

For an ordinary passive PCB interconnect, S11 displayed as log magnitude is usually negative, while return loss is conventionally reported as the corresponding positive number. S11 of −20 dB means 20 dB return loss and 1% reflected power at that frequency and reference plane. It does not mean 20 dB of forward signal loss.
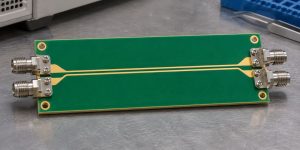
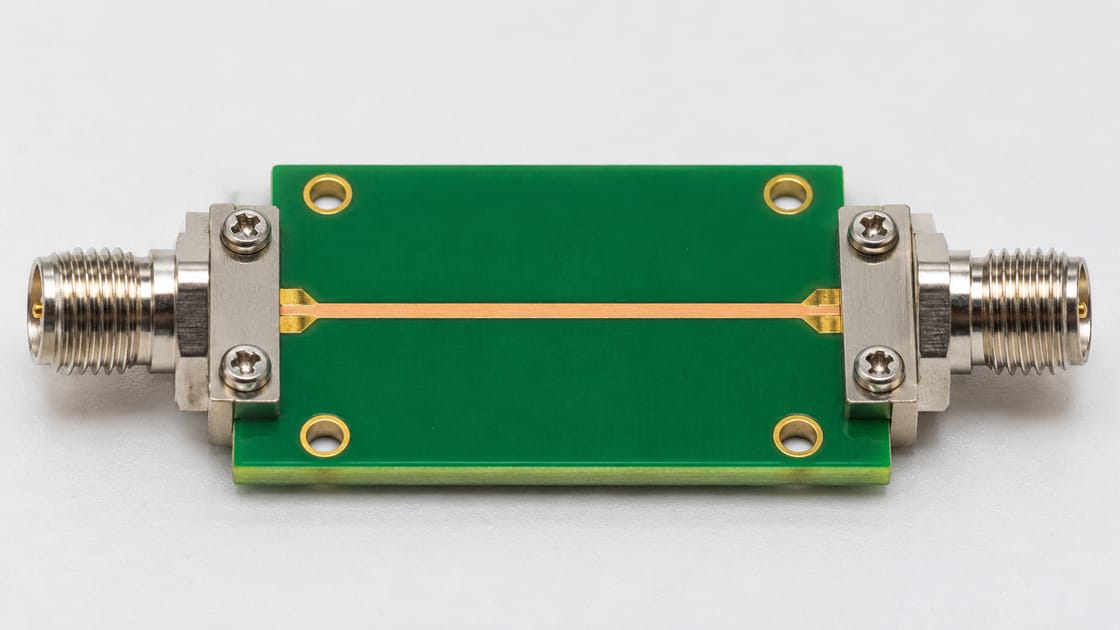
This guide follows a hypothetical RF coupon between two coaxial launches. An engineer receives a plot and needs to determine whether it meets a specified reflection limit. The task is to read the quantity, sign, frequency range, and measurement boundary correctly—not to judge a PCB from one attractive marker value.
What Does S11 Describe on a PCB?
S11 describes the reflected wave at port 1 relative to the incident wave at port 1 under the defined network conditions. It is a complex quantity, carrying magnitude and phase. The familiar negative-dB curve shows a transformation of its magnitude, not the complete complex result.
Keysight’s measurement-parameter documentation distinguishes reflection parameters S11 and S22 from transmission parameters S21 and S12. The port labels matter: a curve cannot be interpreted reliably without knowing where excitation and measurement occur and how the other ports are terminated.
Detailed S11 and Return-Loss Parameters
Write down the parameter definition before comparing a plot with a requirement. For equal real reference impedances in the usual passive interconnect context, use the following relationships. Here Γ denotes the input reflection coefficient and log means base 10.
- S11 log magnitude: 20 log(|Γ|), in dB.
- Return loss: −20 log(|Γ|), in dB.
- Reflected power fraction: |Γ|² = 10−RL/10.
- Record the reference impedance, frequency, calibration plane and termination conditions with every result.
| S11 (dB) | RL (dB) | |Γ| | Power back |
| −6 dB | 6 dB | 0.5012 | 25.12% |
| −10 dB | 10 dB | 0.3162 | 10% |
| −20 dB | 20 dB | 0.1000 | 1% |
| −30 dB | 30 dB | 0.03162 | 0.1% |
These are calculated conversions, not PCB acceptance limits or measured results. The Teledyne LeCroy explanation of S-parameter terminology discusses the sign convention and the distinction between reflection and transmission.
Why More Negative S11 Means Less Reflection
A smaller reflected-to-incident wave ratio has a more negative logarithm. Therefore −30 dB S11 indicates less reflected power than −10 dB S11 at the same measurement conditions. Under the positive return-loss convention, the same comparison becomes 30 dB versus 10 dB.
Avoid saying only “lower return loss is better” or “higher S11 is better.” Name the plotted quantity. For our coupon, a specification of RL ≥20 dB corresponds to S11 log magnitude ≤−20 dB. These are the same reflection requirement written in two conventions, not competing performance targets.
Return Loss vs Insertion Loss
Return loss concerns reflected signal; insertion loss concerns reduction in forward transmission under the stated reference conditions. Their desirable directions differ. A positive return-loss value should usually be large, while a positive insertion-loss value should usually be small for a transparent interconnect.
| Quantity | Usual passive log-magnitude view | What a transparent path aims for |
| S11 | Negative dB reflection trace | Small reflection magnitude |
| Return loss | Positive counterpart of S11 log magnitude | Larger positive value |
| S21 | Forward transmission, often negative dB | Near 0 dB within the intended band |
| Insertion loss | Positive loss derived under stated conditions | Smaller positive value |
For the broader forward-loss question, see the RF PCB insertion-loss guide. Do not substitute that quantity for the reflection criterion.
A Worked Power Example for an RF Coupon
Suppose a hypothetical passive two-port coupon has S11 = −20 dB and S21 = −3 dB at one frequency, with equal real reference impedances and a matched output. The calculated reflected fraction is 10−20/10 = 0.01, or 1%. The forward transmitted fraction is 10−3/10 ≈0.5012, or 50.12%.
About 48.88% remains outside those reflected and transmitted terms in this example. Do not automatically call all of it dielectric heating: losses, radiation, unmodelled paths and measurement limitations need consideration. The lesson is that little reflection does not guarantee nearly complete forward transmission. This is a teaching calculation, not a test report.
Judge the Whole Required Frequency Band
A reflection limit applies over the specified band unless the requirement says otherwise. One deep S11 minimum can coexist with poor matching elsewhere. A marker placed at the best point cannot demonstrate compliance across an operating range.
For the coupon, record the band endpoints and the worst result within that interval. Under the positive return-loss convention, the weakest point is the smallest RL. Under the negative S11 log-magnitude convention, it is the point closest to 0 dB. Check the same band when comparing two revisions or suppliers.
Keep the Reference Impedance Attached to the Result
S11 is referenced to a defined port impedance. A result normalized to one reference cannot be compared casually with a different reference. The relevant value should come from the measurement setup, model, or supplied network data rather than an assumption based on connector appearance.
A nominally 50-ohm test system does not prove that every part of the physical coupon is 50 ohms. It defines a reference for evaluating the structure. If data are renormalized, record that transformation and its basis. Do not describe a changed reference as a physical improvement to the board.
Know Whether the Launches Are Inside the Measurement
The calibration and de-embedding boundary determines which structures the reported network includes. A measurement can contain cable adapters, connectors, launches and PCB traces, or represent a narrower region after an appropriate correction.
In our example, decide whether the requirement applies to the entire connectorized coupon or the trace region alone. Do not blame laminate properties from a launch-inclusive reflection result without further evidence. The related PCB fixture de-embedding guide explains the separate boundary question. A correction must be validated; it is not merely a cosmetic plot adjustment.
Why S11 and S22 Can Tell Different Stories
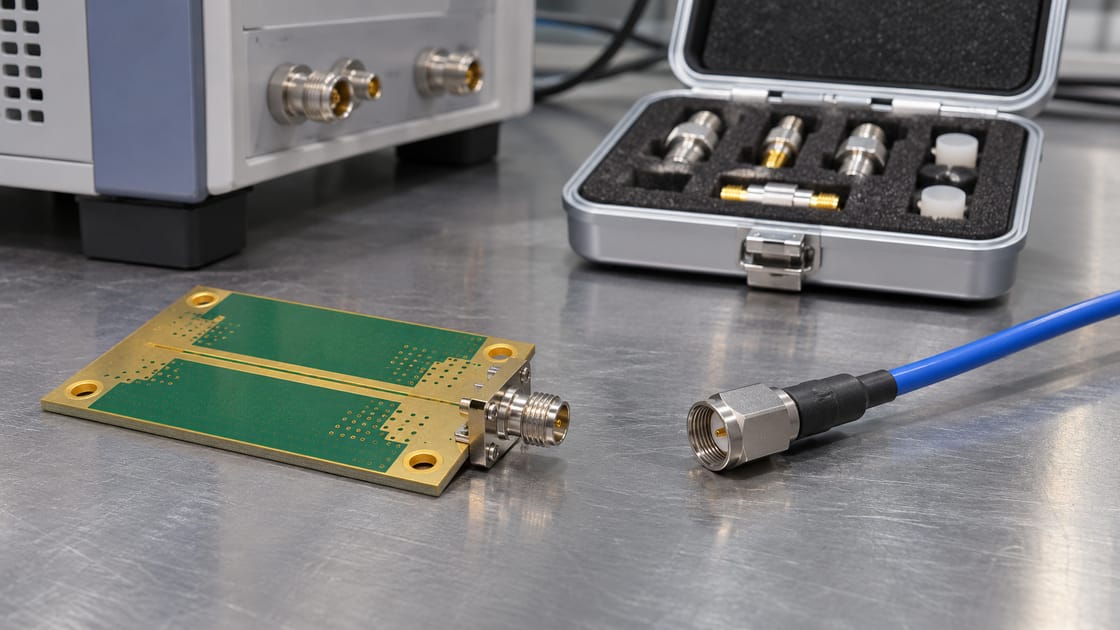
S11 looks into port 1; S22 looks into port 2. A structure with different launches or asymmetric discontinuities can present different reflection behavior from its two ends. Label the physical ports clearly before comparing curves.
Do not assume that similar forward and reverse transmission establishes identical input and output matching. In the controller’s RF path, the installed orientation can make the relevant end especially important. Record both reflection parameters when the test plan requires them and use the specified termination conditions rather than an undocumented open connector.
Single-Ended S11 Is Not Differential Return Loss
A differential interconnect needs the appropriate mixed-mode parameter and port definition. An individual single-ended S11 trace does not by itself describe the differential pair’s reflection behavior. Confirm the pairing, polarity and normalization used in the model or measurement.
Do not relabel a single-ended curve as SDD11 to match a requirement. Request the correct data or a documented conversion from a complete suitable multiport dataset. Keep the scope of this guide clear: the earlier numeric example is an ordinary single-ended two-port example, not a differential-channel qualification.
Investigate a Poor Result Without Guessing the Cause
Check the measurement configuration and repeatability before assigning a PCB defect. Verify connections, calibration applicability, port labels, data format, band and reference plane. Then compare the structure with its released design and any validated model.
A reflection feature can be associated with launches, geometry changes, vias, termination or other discontinuities. The S11 magnitude alone does not uniquely identify which one is responsible. Use additional evidence—such as a controlled comparison or an appropriate time-domain analysis—rather than announcing a root cause from the curve’s shape.
Report a Reflection Requirement Without Sign Ambiguity
A useful report names the quantity, inequality, band, reference impedance and measurement boundary. For example: “Calculated teaching requirement: return loss ≥20 dB across the stated band; equivalent S11 log magnitude ≤−20 dB.” Replace the example threshold with the actual approved requirement.
Include the dataset, setup notes and relevant uncertainty or validation limitations. For our coupon, release requires the agreed evidence across the band, not a universal “good S11” number. Keep forward transmission and other channel requirements in their own acceptance checks so one passing metric cannot conceal another failing one.
FAQ
Is −10 dB S11 better or worse than −20 dB?
For the ordinary passive reflection comparison at the same frequency and conditions, −20 dB indicates less reflection. It corresponds to 1% reflected power, versus 10% at −10 dB. Whether either result is acceptable depends on the actual requirement and operating band. Do not turn these conversion examples into universal PCB pass limits.
Why does a report call a negative trace return loss?
People sometimes use return loss informally to refer to an S11 log-magnitude plot. Read the axis, instrument format and stated formula before applying an inequality. If the report is ambiguous, ask the author to name the quantity explicitly. Changing a label without clarifying its definition can reverse an acceptance decision.
Does a 20 dB return loss mean 99% reaches the output?
No. It means 1% is reflected under the stated conditions. The remaining power is not necessarily all delivered through the intended output; dissipation, radiation or other paths may matter. Check the relevant transmission measurement separately. A well-matched attenuating structure is a useful reminder that input matching and forward transmission are different properties.
Can I add return-loss dB values along a channel?
Not as a general channel calculation. Reflections interact with phase and multiple discontinuities, so scalar return-loss numbers do not preserve enough information to predict the cascade. Use suitable complete network data and a validated connection model. Keep reference impedances, port orientation and measurement boundaries consistent when evaluating the combined structure.
Is dB the same as dBm on an RF plot?
No. A ratio expressed in dB is not an absolute power level in dBm. S11 log magnitude describes a wave ratio, while a receiver power readout can be an absolute quantity. Check the selected measurement and units before converting numbers or comparing them with a reflection specification. Similar-looking axes can represent different physical questions.
What if S11 appears above 0 dB?
First establish the device and measurement context. An active network is not covered by the simple passive assumptions used here. For an expected passive interconnect, examine calibration, processing, reference definitions and uncertainty before drawing conclusions. Do not merely flip the sign or delete inconvenient points to make the curve resemble a typical passive result.
Does a Smith chart contradict the negative-dB trace?
Not necessarily. A Smith chart displays complex reflection information in a different representation. A log-magnitude plot discards phase and shows only a magnitude transformation. Verify that both use the same frequency, port, reference impedance and dataset before comparing them. One view may reveal information that the other deliberately does not display.
What should a supplier send with a return-loss plot?
Request the measured structure identity and revision, port map, frequency range, reference impedance, calibration or de-embedding boundary, and the underlying data where available. Ask how the reported quantity and limit are defined. This makes the plot reviewable and prevents confusion between a connectorized coupon, a corrected trace model and a complete installed channel.
References and RF Enquiries
The linked Keysight and Teledyne LeCroy documentation supports the parameter definitions and sign conventions; the numerical examples are calculated and explicitly hypothetical. For a Best Technology RF PCB enquiry, send the stackup, geometry and measurement requirement to sales@bestpcbs.com. Specific fabrication and verification scope require confirmation.