

PCB manufacturing PCB manufacturing
Home > Blog

What Are the Different Types of Potentiometers and How to Choose the Right One?

September 2nd, 2026

The different types of potentiometers most designers compare are rotary, slide, trimmer, and digital potentiometers. Rotary and slide types are routine human controls, trimmers are compact calibration controls, and digital potentiometers replace mechanical movement with electronic adjustment. The right choice also depends on resistance, taper, turn count, element construction, power, mounting, and environmental ratings.

These names are easy to mix because they do not all describe the same feature. A part can be rotary, logarithmic, dual-gang, conductive-plastic, and panel-mounted at the same time. This guide keeps the type map compact, explains the differences that change a real selection, and ends with a practical method for choosing an exact part.

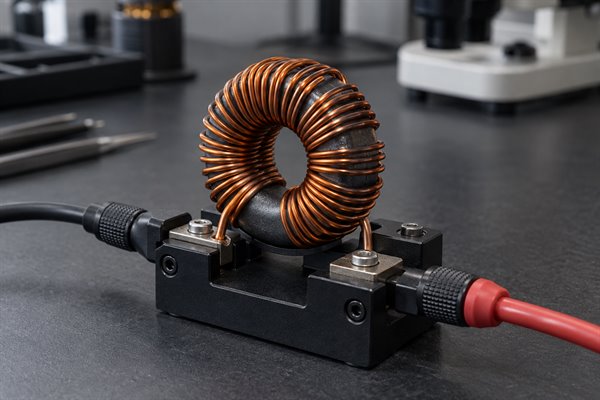
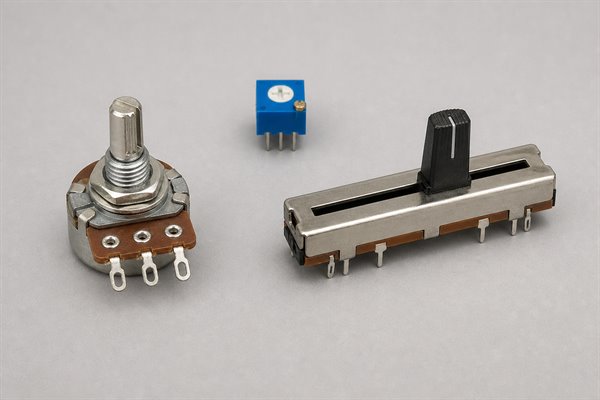
Different Types of Potentiometers including rotary, slide, and trimmer controls on an electronics workbench

What Are the Different Types of Potentiometers?

Use this table as a classification map, not as a list of mutually exclusive products. Each group answers one engineering question: how the control moves, how finely it must be adjusted, or whether the setting is mechanical or electronic. Compare options only within the same classification dimension.

Classification Dimension Potentiometer Type Preferred Application Critical Selection Criteria
Interface motion Rotary potentiometer Compact knobs, dials, and panel set-point controls Rotation angle, shaft and bushing geometry, operating torque, and taper
Interface motion Slide potentiometer Visible linear position control, including faders and multi-channel interfaces Travel length, lever geometry, mounting support, and contamination protection
Calibration resolution Single-turn trimmer Fast, compact calibration when fine mechanical resolution is unnecessary Tool access, setting stability, adjustment range, and end-stop protection
Calibration resolution Multi-turn trimmer Fine calibration where a narrow target must be approached gradually Turn count, adjustment time, end-stop torque, and mechanical life
Control architecture Mechanical potentiometer Direct hand or tool adjustment without firmware control Operating life, contact-resistance variation, sealing, and environmental rating
Control architecture Digital potentiometer Remote, automatic, or repeatable adjustment controlled by a processor Terminal voltage limits, wiper resistance, resolution, interface, and memory behavior

A finished component can combine one option from more than one group. For example, a multi-turn trimmer is also mechanical, while a rotary potentiometer may use a linear or audio taper and a carbon, cermet, or conductive-plastic element. Use the table to select the control format first, then apply the electrical specifications in the sections below. Do not compare rotary and digital as though they were mutually exclusive alternatives.

How Do Rotary, Slide, and Trimmer Potentiometers Differ?

Rotary and slide potentiometers are selected by the required user motion, while trimmers are selected for occasional calibration. None is inherently more accurate or reliable; the exact series, construction, and ratings determine performance.

Rotary, slide, and trimmer potentiometers shown as common mechanical potentiometer types
  • Rotary potentiometers: A shaft turns the wiper along a resistive track. They fit compact knobs, dials, audio controls, set-point controls, and many panel interfaces. Check the rotation angle, shaft profile and length, bushing, torque, end stops, panel thickness, and clockwise electrical direction.
  • Slide potentiometers: A lever moves the wiper along a straight track. The lever position is immediately visible, which suits mixers, lighting controls, and other interfaces where users compare several settings. Check travel length, lever style, mounting support, dust protection, and clearance through the full stroke.
  • Single-turn trimmers: A tool adjusts the setting over roughly one turn or less. They suit compact, cost-sensitive calibration where the target does not require extremely fine mechanical adjustment. Verify tool access and whether the setting can move during handling, vibration, or cleaning.
  • Multi-turn trimmers: A screw mechanism spreads the electrical range over several turns. This makes a narrow target easier to approach, but adjustment takes longer and excessive end-stop torque can damage the mechanism. Use them when calibration resolution justifies the extra space, cost, and production time.

A trimmer is still a potentiometer; the term describes its adjustment role. Likewise, a rotary part can be single-turn or multi-turn, and a slide part can use different electrical tapers. Use the mechanical drawing and the complete order code to verify the actual combination.

Which Electrical Differences Matter When Choosing a Potentiometer?

After choosing the physical format, six electrical differences usually decide whether the part will work in the circuit. Compare these values in the exact candidate datasheet rather than relying on the type name or body marking.

  • Total resistance: Choose the nominal end-to-end resistance from the source impedance, load, current, noise, and power requirements. A 10 kΩ part is not interchangeable with every other 10 kΩ part because the surrounding circuit changes the usable wiper output.
  • Electrical taper: A linear taper changes resistance ratio approximately in proportion to travel. A logarithmic or audio taper compresses change over part of the travel to suit perceptual controls such as audio level. Reverse-log and custom curves serve more specialized control laws. Manufacturer letter codes are not universal, so verify the curve shown for the exact order number.
  • Power and wiper current: Check total element power, derating with temperature, and the worst-case current through the wiper. In a rheostat connection, the active resistance becomes smaller near one end, so current and local heating can become the limiting conditions.
  • Element construction: Carbon is common in economical general-purpose controls. Cermet is widely used in stable compact trimmers. Conductive plastic can support smooth operation and long mechanical life in suitable controls. Wirewound designs can handle higher power but introduce step resolution and inductance. Treat these as selection tendencies, not guaranteed performance; compare the finished component ratings.
  • Tolerance, linearity, and tracking: Total-resistance tolerance does not describe the accuracy of the wiper ratio. For sensing or dual-channel control, check independent linearity, contact-resistance variation, channel tracking, and performance at the positions that matter to the circuit.
  • Life and environment: Rotational or sliding life, temperature coefficient, humidity, sealing, vibration, and contamination resistance can matter more than nominal resistance. Match the rating conditions to the product environment and expected number of adjustments.

The Bourns Potentiometer Handbook explains the relationships among element construction, taper, loading, power, and adjustment behavior. Use that guidance to compare options, then verify every release-critical value in the exact candidate datasheet.

How Do Digital and Mechanical Potentiometers Differ?

A mechanical potentiometer moves a physical wiper, while a digital potentiometer uses electronic switches to select resistance steps. Choose the mechanical type for direct hand or tool adjustment. Choose the digital type when a controller needs repeatable, remote, or automatic adjustment and the analog signal stays within the IC’s limits.

A digital potentiometer uses electronically controlled switches and a resistor network. It can provide fixed adjustment steps, a compact footprint, and software-controlled presets without a moving contact. Common uses include gain trim, threshold adjustment, calibration, and digitally managed analog settings.

Choose it only after checking these boundaries:

  • Terminal voltage range: The A, B, and W terminals normally have device-specific limits, often related to the supply rails. Check normal operation, startup, shutdown, and fault states.
  • Wiper resistance and current: Internal switch resistance affects low codes and low nominal values, while terminal current is limited. Calculate the error and stress at the worst position.
  • Resolution and accuracy: The number of steps does not establish end-to-end tolerance, linearity, or temperature drift. Confirm the output range and error at the codes the application will use.
  • Bandwidth and capacitance: The internal network can change AC behavior in filters, amplifiers, and feedback paths. Verify performance at the real signal frequency.
  • Interface and stored state: SPI, I2C, up/down control, volatile or nonvolatile memory, write endurance, and power-up code affect both hardware and firmware behavior.

Analog Devices AN-1121 describes the architectural differences between mechanical and digital potentiometers and explains why terminal range, wiper behavior, and control method must be checked for the selected IC.

How Do You Choose the Right Potentiometer?

Choose the right potentiometer by fixing the circuit function first, then the control format, electrical behavior, ratings, package, and validation method. This seven-check sequence should end with an exact manufacturer part number or a bounded approved-vendor list. Skipping the loading, power, or mechanical checks risks approving a part that has the right nominal resistance but fails in the actual circuit or enclosure.

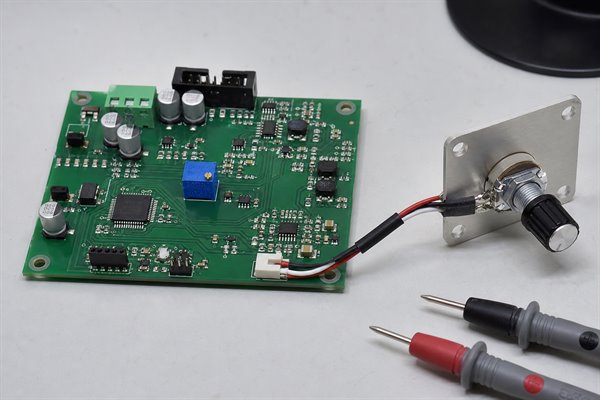
Potentiometer PCB integration used to choose mounting, package, and validation details
  1. State the adjustment job. Record whether the part sets a voltage ratio, gain, threshold, time constant, user level, position input, or calibration value. Record the required direction of change and how often the setting will move.
  2. Choose the control type. Use rotary or slide for routine user input, a trimmer for occasional calibration, or a digital pot for controller-driven adjustment. The observable output is one justified control architecture and physical format.
  3. Set resistance and taper. Calculate nominal resistance from the source and load, then choose linear, audio/logarithmic, reverse-log, or a specified custom curve from the required output-versus-travel relationship.
  4. Check worst-case electrical ratings. Verify terminal voltage, wiper current, element power, temperature derating, tolerance, linearity, contact-resistance variation, bandwidth, and channel tracking where applicable.
  5. Match adjustment precision and construction. Decide whether single-turn or multi-turn motion is needed, then compare element constructions using the candidate series’ actual stability, noise, life, temperature, and power data.
  6. Close the mechanical and environmental fit. Confirm footprint, pin order, shaft or lever, orientation, panel thickness, mounting support, tool access, sealing, cleaning restrictions, vibration, and expected operating cycles.
  7. Set a simple acceptance check. Measure end-to-end resistance, output direction, useful travel, and the loaded output at important positions. For digital parts, also verify communication, power-up state, allowed code range, and recovery after reset.

Do not release a BOM entry such as "10 kΩ pot" without the remaining qualifiers. At minimum, the approved description should identify type, taper, tolerance, power, package, mounting, actuator or adjustment style, environmental option, and any tracking or life requirement that controls the design.

FAQs About Different Types of Potentiometers

Q1: What are the four main types of potentiometers?

A1: Rotary, slide, trimmer, and digital is a useful practical list. However, the labels use different axes: rotary and slide describe motion, trimmer describes adjustment role, and digital describes control architecture.

Q2: What is the difference between a potentiometer and a rheostat?

A2: A potentiometer normally uses three terminals as a voltage divider. A rheostat connection uses the wiper and one end terminal as a two-terminal variable resistance. A three-terminal potentiometer can often be wired either way within its ratings.

Q3: Why does a potentiometer have three terminals?

A3: Two terminals connect to the ends of the resistive element, and the third connects to the movable wiper. Applying voltage across the two ends lets the wiper produce an adjustable fraction of that voltage.

Q4: Is a trimmer the same as a potentiometer?

A4: Yes, a trimmer is a potentiometer designed mainly for calibration or occasional service adjustment. It is usually tool-operated and board-mounted rather than intended for frequent user control.

Q5: Is a multi-turn potentiometer more accurate?

A5: Multi-turn motion improves adjustment resolution, not every accuracy specification. Resistance tolerance, linearity, temperature coefficient, contact noise, and stability must still be checked separately.

Q6: Are A and B potentiometers linear or logarithmic?

A6: Do not treat A and B as universal taper codes. The meaning can vary by manufacturer or family. Decode the complete part number and check the current curve drawing before substitution.

Q7: Can a linear potentiometer control audio volume?

A7: It can change level, but the control may feel uneven to the listener. A suitable logarithmic or audio taper often spreads perceived loudness adjustment more usefully across the travel. Confirm the source and load circuit as well as the curve.

Q8: Can a digital potentiometer pass a signal above its supply voltage?

A8: Many digital potentiometers cannot. A, B, and W terminal limits are device-specific and are often tied to the supply rails. Check all operating and fault states in the selected datasheet.

Q9: How can you identify a potentiometer’s resistance value?

A9: Decode the body marking with the manufacturer’s ordering information, then measure between the two end terminals. Resistance alone does not identify taper, tolerance, power, pin order, or environmental rating.

Q10: What causes a potentiometer to become noisy or intermittent?

A10: Common causes include wiper or element wear, contamination, mechanical damage, cracked solder joints, excessive wiper current, or noise in the surrounding circuit. Sweep the control while monitoring resistance or output to determine whether the fault follows wiper position.

Conclusion

Start with rotary, slide, trimmer, or digital as the control choice, then qualify that choice with the electrical taper, resistance, ratings, construction, and package. This keeps the different types of potentiometers easy to understand without treating every feature as a separate category. The final decision should be an exact part whose datasheet limits and mechanical drawing match the circuit and product.

If a potentiometer is part of a PCB or PCBA project, send the BOM or candidate part number, required resistance and taper, adjustment function, quantity, enclosure constraints, operating environment, and acceptance requirements to sales@bestpcbs.com for component and assembly review.

You may also like

How Does an Insulated Gate Bipolar Transistor Work?

September 1st, 2026

An insulated gate bipolar transistor, or IGBT, is a voltage-controlled power switch that combines a MOS gate with a bipolar current path. It is widely used in motor drives, solar inverters, UPS systems, welding equipment and induction-heating power stages because it can control substantial current at high voltage without continuous gate current.

A useful IGBT design starts with more than a part number. You need to decide whether an IGBT suits the converter, read its ratings under the correct test conditions, estimate losses and junction temperature, and then design the gate drive, current loops, cooling and protection as one system. This guide gives you that sequence, with calculations, waveform checks and the information needed for a practical PCB review.

insulated gate bipolar transistor, power semiconductor devices beside a control PCB and heat sink

What Is an Insulated Gate Bipolar Transistor?

An IGBT is a three-terminal semiconductor used as an electronic power switch. Its gate receives the control signal, while its collector and emitter carry the load current. The insulated input gives the gate high impedance. The bipolar conduction mechanism lowers the on-state voltage in operating regions where high-voltage MOSFET conduction loss may be less attractive.

The three terminals have different jobs. The gate is charged or discharged by the driver. The collector usually connects to the high-voltage side or a switching node. The emitter returns the main current and also provides the voltage reference for the gate drive. Some packages add a Kelvin emitter pin so the driver can avoid voltage error caused by inductance in the power-emitter path.

A discrete IGBT contains one controlled switch. An IGBT module may combine several dies, freewheel diodes, sensors and internal interconnects. Neither is a complete converter. The assembly still needs a DC-link network, isolated or level-shifted gate drivers, current sensing, fault shutdown and a thermal path. This distinction prevents a common mistake: choosing a module by its headline current rating before defining how the system will drive and cool it.

How Does an IGBT Turn Power On and Off?

Gate-emitter voltage creates a MOS channel that enables bipolar conduction from collector to emitter. When the gate is held below its turn-on condition, the device blocks collector-emitter voltage within its rated limits. When the driver raises the gate, the channel forms and permits carrier injection into the drift region. This conductivity modulation supports efficient high-voltage current conduction.

Turning the gate off removes the MOS channel quickly, but charge stored in the drift region cannot disappear instantly. The remaining current decays as a turn-off tail. That tail adds turn-off energy and explains why an IGBT often switches more slowly than a power MOSFET. Higher junction temperature can increase the stored-charge effect, so room-temperature switching results do not establish the worst case.

The driver controls how fast the transition occurs by moving charge through the gate resistance and parasitic inductance. A faster edge may reduce switching duration, but it can increase voltage overshoot, ringing, electromagnetic interference and capacitive turn-on of the opposite switch. The correct target is therefore a controlled waveform with acceptable loss and stress, rather than the shortest possible rise or fall time.

insulated gate bipolar transistor, diagram of gate control and collector-to-emitter power flow

When Is an IGBT a Better Choice Than a MOSFET?

An IGBT is a strong candidate when a converter switches high voltage and substantial current at a moderate switching frequency. A MOSFET is often preferred when switching frequency is higher, reverse conduction is important or low-voltage resistive loss is favorable. There is no universal crossover voltage or frequency because semiconductor generation, die size, topology, temperature and cooling all move the boundary.

Design Condition IGBT Implication MOSFET Implication Decision Check
High bus voltage and current Moderate on-state voltage can be attractive. RDS(on) and temperature drive conduction loss. Compare total loss at actual current and temperature.
High switching frequency Turn-off tail can make switching loss dominant. Fast majority-carrier switching may reduce transition loss. Calculate or measure switching energy.
Reverse current Usually needs a separate or co-pack diode. Body-diode and third-quadrant behavior are part of the device. Review diode loss, recovery and dead-time path.
Short-circuit exposure Specified withstand time may support DESAT shutdown. Fault current can rise very quickly. Match protection delay to the device fault limit.
Available cooling Module and discrete packages offer different heat paths. Parallel devices may spread loss but complicate sharing. Estimate junction temperature for each candidate.

Compare the candidates over the real operating cycle rather than one nominal point. A motor drive may spend long periods at partial load and then experience short acceleration peaks. Include conduction loss, switching loss, diode behavior, driver power and cooling limits for those conditions. Choose the device that meets efficiency and temperature targets with acceptable waveform margin.

Which IGBT Ratings Determine Whether It Fits Your Circuit?

The decisive ratings are blocking voltage, current under real thermal conditions, on-state voltage, switching energy, gate charge, fault capability and thermal impedance. Every value must be read with its test conditions. A current rating measured at a controlled case temperature is not the current a sealed enclosure can deliver continuously.

Datasheet Item What It Tells You Required Design Input Verification
VCES Collector-emitter blocking limit Maximum DC bus, regeneration and transient conditions Measure worst-case overshoot with a suitable probe.
IC and pulsed current Current capability under stated thermal limits RMS, average and peak current waveforms Apply temperature and pulse-duration derating.
VCE(sat) On-state voltage at stated current, gate voltage and temperature Conduction current and duty cycle Use the curve nearest the real operating point.
Eon and Eoff Energy dissipated during each transition Bus voltage, current, frequency, RG and temperature Match test conditions and confirm with waveforms.
QG and Miller charge Charge the driver must source and sink Target edge time and gate-voltage swing Check peak drive current and gate waveform.
Rth(j-c) and Zth Steady-state or transient heat transfer Power-loss profile and cooling path Calculate and measure junction-temperature margin.
SOA and short-circuit data Permitted voltage-current-time stress Fault current, starting temperature and shutdown time Prove protection clears before the stated limit.

Also check the gate-emitter absolute maximum, recommended gate voltages, leakage current, internal diode data, isolation rating for modules, mounting torque and mechanical flatness. Use maximum ratings as boundaries, not operating targets. A design should preserve margin for production tolerances, temperature, aging and measured switching transients.

How Can You Estimate IGBT Loss and Junction Temperature?

Estimate conduction and switching loss separately, add the other power-stage losses, and then apply the thermal path. This first-pass calculation shows whether the device and cooling concept are plausible. Final values require manufacturer curves at conditions close to the application and hardware measurements with safe probing.

Pcond ≈ VCE(sat) × IC × D

Psw ≈ (Eon + Eoff) × fsw

Consider a clearly hypothetical operating point: VCE(sat) is 1.9 V at 40 A, and the IGBT conducts for half the cycle. The first estimate is 1.9 × 40 × 0.5 = 38 W of conduction loss. If Eon + Eoff is 3.2 mJ at the intended voltage and current, switching at 10 kHz adds 0.0032 × 10,000 = 32 W of switching loss. The IGBT subtotal is about 70 W before diode, gate-driver, snubber and other losses.

Those numbers are an example, not a recommended operating point. A sinusoidal inverter has changing current, so calculate over the electrical cycle or use a validated simulation. Scale switching energy carefully for bus voltage, current, gate resistance and temperature. If the datasheet conditions differ substantially, a double-pulse test is the more reliable way to establish switching energy.

For a steady condition, a simplified junction estimate is:

Tj ≈ Tcase + Ploss × Rth(j-c)

If the example device dissipates 70 W and Rth(j-c) is 0.25 °C/W, the junction is about 17.5 °C above the measured case temperature. This does not include case-to-sink interface resistance or sink-to-ambient rise. For pulses, use transient thermal impedance rather than steady Rth. Validate the full chain at maximum ambient, worst airflow and realistic mounting pressure.

insulated gate bipolar transistor, thermal path from semiconductor junction through case and heat sink

What Must an IGBT Gate Driver Control?

The driver must control gate voltage, peak source and sink current, switching speed, isolation and fault shutdown. A logic output alone rarely supplies the current or protection needed by a power IGBT. Select the driver after defining total gate charge, desired switching time, common-mode transient stress and the protection response.

A first estimate of transition current is IG ≈ QG/t. If total gate charge is 200 nC and the desired transition is 200 ns, the average current during that interval is about 1 A. The real peak can differ because gate current changes through the Miller plateau and the loop has resistance and inductance. Confirm the driver’s source and sink ratings at the actual supply voltage and temperature.

  • Gate-voltage range: use the recommended on and off values, not merely the absolute maximum. Observe the gate-emitter waveform at the device pins and verify that overshoot remains inside the limit.
  • Separate turn-on and turn-off control: different resistors or a diode-resistor network can balance turn-on loss against turn-off immunity. Record both resistor values with the measured switching result.
  • Miller immunity: high collector dV/dt can inject current through the Miller capacitance. A strong sink, Miller clamp, negative off voltage or lower-inductance gate loop can prevent false turn-on.
  • Isolation and common-mode behavior: choose insulation ratings and transient immunity for the system voltage and switching edge. Keep primary and secondary copper separated according to the applicable safety design.
  • Undervoltage lockout: prevent operation when the driver supply cannot enhance the IGBT correctly. Verify clean shutdown during both power-up and power-down.
  • Fault response: coordinate DESAT detection, blanking time, soft turn-off and controller reporting with the device’s short-circuit capability.

Place a gate-emitter resistor close to the device so the gate does not float if the driver is disconnected. Add a local gate clamp when the driver and layout cannot guarantee the voltage limit. These components should be selected from measured gate and collector waveforms, because overly aggressive clamping or resistance can slow fault response or increase switching loss.

How Should You Lay Out an IGBT Power Stage on a PCB?

Minimize the gate loop and commutation loop, separate noisy switching copper from controls, and give current and heat predictable paths. Parasitic inductance converts rapid current change into voltage error and overshoot. A schematic can be correct while long loops make the hardware unstable or overstressed.

  1. Place the driver beside the gate and emitter reference. Route the outgoing gate path and return together. The observable result should be a clean gate waveform without excessive ringing or bounce relative to the device emitter.
  2. Use the Kelvin emitter when available. Keep the driver return separate from the power emitter until the package connection. This prevents load-current di/dt from changing the effective gate voltage.
  3. Keep the DC-link capacitor close to the switching pair. The capacitor, high-side device and low-side device form the main commutation loop. Reducing its area lowers bus overshoot and ringing.
  4. Control the switch-node area. Large high-dV/dt copper increases capacitive coupling. Keep it away from gate traces, current-sense inputs, isolation boundaries and low-level control circuits.
  5. Route current-sense and protection signals as measurements. Use dedicated returns or differential routing where appropriate. Place DESAT and gate-clamp parts according to the driver’s loop requirements.
  6. Design the copper and terminals for current and heat. Review RMS current, allowable temperature rise, copper thickness, via arrays, connector resistance and mechanical current sharing.
  7. Add safe test access. Provide points for gate-emitter voltage, collector-emitter voltage, current and driver supplies. The probe connection must not create a larger loop than the circuit being measured.
insulated gate bipolar transistor, PCB layout showing short gate and power commutation loops

Use measured waveforms to close the layout review. Excess collector overshoot points to commutation inductance, snubber selection or measurement error. Gate bounce during the opposite switch transition points to common-emitter inductance or Miller coupling. Repeated ringing at a fixed frequency suggests an LC resonance. Each observation should lead to a physical loop or component check before changing gate resistance by trial and error.

Which Protection Functions Prevent IGBT Failure?

Effective protection detects overcurrent, false turn-on, overvoltage, driver undervoltage and overheating before the device exceeds its time-dependent limit. A fuse can protect wiring and contain severe faults, but it is usually too slow to protect the semiconductor from a short circuit by itself.

Observed Stress Likely Mechanism Protection Validation
Rapid current rise with high VCE Load short circuit or shoot-through DESAT or fast current trip with coordinated soft turn-off Measure total detection and shutdown time.
Gate rises while commanded off Miller current or common-emitter inductance Strong sink, clamp, negative bias and Kelvin return Observe the gate during the opposite transition.
Collector voltage overshoots Stray inductance and fast di/dt Tighter loop, controlled edge, clamp or snubber Probe at the device under worst current and bus voltage.
Driver supply falls Insufficient local energy or supply capacity UVLO, local decoupling and suitable isolated supply Check supply at the driver pins during switching.
Temperature exceeds target Excess loss or inadequate cooling path Temperature sensing, derating and controlled shutdown Validate at maximum ambient and reduced airflow.

Protection thresholds and delays form a timing budget. Add current-sensor delay, DESAT blanking, digital filtering, isolator delay, driver response and turn-off time. The total must remain inside the device limit at the starting junction temperature. Test controlled fault cases with current-limited equipment and a written safety procedure instead of creating an unrestricted short circuit.

How Can You Test an IGBT Without Damaging the Circuit?

Begin with de-energized screening, then use current-limited functional tests before full-voltage switching tests. A multimeter may reveal an open gate, shorted collector-emitter path or abnormal diode junction, but it cannot prove switching energy, dynamic voltage margin, gate stability or short-circuit survival.

  1. Make the system safe. Disconnect power, discharge the DC link, verify zero voltage with a rated instrument and follow the equipment’s lockout procedure. High-energy capacitors remain dangerous after input power is removed.
  2. Inspect before measuring. Look for cracked packages, lifted terminals, discolored PCB areas, loose bus connections, damaged gate resistors and failed snubbers. A failed surrounding part may have caused the IGBT failure.
  3. Screen the terminals. With the gate discharged, compare collector-emitter and gate-emitter readings with a known-good device or manufacturer guidance. A near-zero collector-emitter reading in both directions usually deserves further investigation.
  4. Check the gate network. Measure the gate resistor, gate-emitter resistor, clamp and driver supply. Confirm there is no leakage path that keeps the gate partially charged.
  5. Use a low-energy switching test. Apply a limited bus voltage and current, confirm correct driver timing and observe the gate and collector waveforms with properly rated differential or isolated probes.
  6. Increase stress in controlled steps. Record overshoot, current, temperature and fault behavior at each step. Stop if the waveform exceeds the approved boundary or changes unexpectedly.

Do not test an IGBT in-circuit by randomly applying gate voltage. Parallel devices, bootstrap supplies, stored energy and controller interlocks can create unintended conduction. When a power stage fails, check the driver channel, opposing switch, current sensor, diode, snubber and DC-link capacitor before fitting a replacement.

What Should You Prepare Before Selecting an IGBT or Requesting a PCB Review?

Prepare the electrical stress profile, switching target, cooling conditions, protection timing and complete PCB design data. This turns device selection and DFM review into a checkable engineering task instead of a request for a generic “high-current IGBT.”

  • Electrical conditions: minimum, nominal and maximum DC-bus voltage; regeneration or surge behavior; RMS, average and peak current; duty cycle; topology and reverse-current path.
  • Switching conditions: target frequency, gate voltages, gate resistance, dead time, expected dV/dt and dI/dt, acceptable overshoot and EMI constraints.
  • Thermal conditions: ambient range, airflow, heat-sink or cold-plate details, interface material, mounting method, maximum case temperature and duty profile.
  • Protection conditions: current threshold, DESAT or comparator delay, soft-turn-off behavior, UVLO, overtemperature response and safe restart policy.
  • Mechanical and production data: device package, terminal current, creepage and clearance targets, enclosure limits, copper weight, board thickness, stackup and assembly process.
  • Review files: schematic, BOM with exact manufacturer part numbers, Gerber or ODB++ data, drill files, stackup, placement, mechanical drawing and relevant simulation or waveform results.

For a useful PCB review, mark the gate loop, commutation loop, switch node, isolation boundary and heat path in the design package. EBest Circuit can review those inputs for manufacturability and clarify PCB stackup, copper, via and assembly constraints before production. The review cannot replace device-level electrical or safety validation, so keep the operating assumptions and required test results with the released design.

Which IGBT Questions Still Need Quick Answers?

Q1: What does IGBT stand for?

A1: IGBT stands for insulated gate bipolar transistor. The name describes its insulated MOS gate and its bipolar conduction path.

Q2: Is an IGBT voltage-controlled or current-controlled?

A2: It is called a voltage-controlled device because gate-emitter voltage commands the state. The driver still supplies charging and discharging current during each transition.

Q3: What are the three IGBT terminals?

A3: The terminals are gate, collector and emitter. The gate controls the device, while the collector and emitter form the main power-current path.

Q4: Does an IGBT conduct reverse current?

A4: A conventional IGBT is mainly a unidirectional controlled switch. Reverse current usually flows through a separate or co-pack freewheel diode, so confirm the module circuit.

Q5: Can a microcontroller drive an IGBT directly?

A5: Usually not in a practical power stage. An IGBT normally needs a dedicated gate driver for peak current, voltage level and isolation, plus UVLO and fault shutdown.

Q6: Why is a gate resistor necessary?

A6: It controls gate current and switching speed. Its value changes switching loss, overshoot, ringing and EMI, so confirm it with measured gate and collector waveforms.

Q7: What does VCE(sat) mean?

A7: It is the collector-emitter voltage while the IGBT is on under stated conditions. Use it with current and duty cycle for a first conduction-loss estimate.

Q8: Why does an IGBT have tail current?

A8: Stored carriers remain after the gate channel turns off. Their removal creates tail current, which adds turn-off time and switching energy.

Q9: Does every IGBT need negative gate voltage when off?

A9: No. The need depends on Miller coupling, driver sink strength and loop inductance. Follow the device and driver guidance, then verify off-state gate margin during the opposite switch transition.

Q10: What is the most common IGBT PCB layout mistake?

A10: A common mistake is allowing the gate or commutation loop to become too large. The resulting parasitic inductance can cause gate bounce, overshoot, ringing and false turn-on.

An effective insulated gate bipolar transistor design is a chain of linked decisions. Select the switch from the real electrical and thermal profile, size the driver from gate charge and timing, control the physical loops, and prove protection with measured waveforms. When those inputs are documented before PCB release, manufacturing review and hardware validation become much more reliable.

Need help sourcing the components for your IGBT power stage? Send EBest Circuit your BOM with manufacturer part numbers, approved alternatives, required quantities, target delivery date and traceability requirements. Our component sourcing team can review availability and substitution constraints together with your PCB or PCBA requirements and prepare a quotation. Contact us with your BOM to start the component procurement review.
You may also like

Standard Copper Busbar Sizes: A Buyer’s Selection Guide

August 17th, 2026

Standard copper busbar sizes can shorten sourcing time, but width and thickness alone do not make a part safe or ready to build. If material, current conditions, hole pattern, finish, and tolerances are unclear, the result may be overheating, poor terminal alignment, enclosure interference, or a quotation based on the wrong part.

This matters when the busbar connects to a PCB, terminals, or an assembled power module. A small dimension change can affect mounting holes, clearances, tool access, and the assembly sequence. If you send us the released busbar drawing and PCB files, the EBest Circuit (Best Technology) team can review the manufacturing interfaces together, point out missing quotation details, and help you define a practical PCB/PCBA, inspection, and testing scope. Your engineers keep control of the electrical design and final approval; our role is to make the handoff easier and reduce avoidable surprises before production.

Standard copper busbar sizes

Standard Copper Busbar Sizes in mm and Inches

There is no single worldwide list of standard copper busbar sizes. In practice, “standard” usually means a size regularly stocked by a mill, distributor, or fabricator. Availability varies by region, copper grade, temper, length, quantity, and supplier.

Metric tables commonly show width × thickness, such as 40 × 5 mm. North American tables may show thickness × width, such as 1/4 × 2 in. Always label both dimensions and units on the drawing; an unlabeled pair can be reversed during quotation or manufacturing.

Common reference thicknesses include:

  • Metric: 3, 5, 6, 8, and 10 mm.
  • Imperial: 1/16, 1/8, 3/16, 1/4, 3/8, and 1/2 in.
  • Larger or unusual combinations may require plate cutting or a custom material order.

ASTM B187/B187M covers requirements for copper bar, bus bar, rod, and shapes and lists several copper UNS designations for electrical applications. It is a material specification, not a universal stock catalogue. The purchase order and released drawing still need the copper grade, dimensions, tolerances, finish, and any certificate requirements.

Buyer check: Confirm the exact stock form with the proposed supplier before freezing the design. A size shown online may not be available in the required grade, length, or quantity.

Standard Copper Busbar Sizes Chart

This chart is a dimensional reference, not an ampacity table. The combinations are common examples, but they are not a promise of supplier availability.

Nominal width × thickness Cross-sectional area Approximate inch equivalent Confirm before release
20 × 3 mm 60 mm² 0.787 × 0.118 in. Grade, length, cutting tolerance
25 × 3 mm 75 mm² 0.984 × 0.118 in. Width/thickness order
30 × 3 mm 90 mm² 1.181 × 0.118 in. Edge condition and flatness
40 × 5 mm 200 mm² 1.575 × 0.197 in. Hole clearance and bends
50 × 5 mm 250 mm² 1.969 × 0.197 in. Finish and contact areas
60 × 5 mm 300 mm² 2.362 × 0.197 in. Length and assembly envelope
80 × 10 mm 800 mm² 3.150 × 0.394 in. Support, hardware, tooling
100 × 10 mm 1,000 mm² 3.937 × 0.394 in. Enclosure space and tolerances

Cross-sectional area equals width multiplied by thickness, but equal area does not guarantee equal performance. Shape also affects surface area, stiffness, bending, connection geometry, AC effects, and heat dissipation.

Do not silently replace a metric size with the nearest inch fraction. For example, 5 mm and 3/16 in. are close but not identical. The difference can affect holes, bends, stack height, terminal alignment, and clearances. Record every approved alternative on the controlled drawing.

How to Select Busbar Size?

Start with the customer’s validated electrical and mechanical requirements, then compare those requirements with real stock availability.

Electrical inputs:

  • Continuous, peak, and fault current.
  • AC frequency or DC operation.
  • Ambient temperature and permitted temperature rise.
  • Enclosure, ventilation, bar spacing, orientation, and parallel bars.
  • Joint design, plating, allowed voltage drop, and protection strategy.

Mechanical and integration inputs:

  • Space around the PCB, terminals, enclosure, and other conductors.
  • Holes, slots, bends, datums, and critical tolerances.
  • Supports, vibration, weight, and installation sequence.
  • Finish, masking, insulation, and contact areas.

If a stocked size meets the released requirements, it may reduce lead time and waste. If it does not, use a controlled custom route instead of weakening clearances, joints, or mechanical requirements to fit a catalogue bar.

Standard copper busbar sizes

How Copper Busbar Size and Current Rating Relate

Copper busbar size and current rating are related, but there is no universal conversion from cross-sectional area to allowable current. A published value is valid only under its stated conditions.

The Copper Development Association’s rectangular-busbar data shows that temperature rise, surface emissivity, number of bars, spacing, and configuration can change ampacity. Enclosure and ventilation conditions also influence temperature rise. A bare bar in open air should not inherit the same current rating when it is enclosed, coated, stacked, or connected through poorly controlled joints.

Before accepting a current value, confirm:

  • The source table, standard, calculation, or test report.
  • Copper grade, dimensions, orientation, and surface condition.
  • Ambient temperature and permitted temperature rise.
  • AC/DC conditions, frequency, spacing, parallel bars, and enclosure.
  • Joint design, terminal limits, protection, and validation method.

A size chart can narrow the options; it cannot approve the final conductor. The customer releases the rating and acceptance criteria. A useful manufacturing review then checks whether the received drawing, PCB interface, controlled dimensions, and proposed inspection or test evidence agree with that release.

Copper Bus Bar Stock or Custom Size?

Standard copper bus bar stock can reduce sourcing time when its grade, dimensions, and tolerances match the released part. A custom route is more suitable when the approved envelope, terminal geometry, bends, hole pattern, or current path cannot be met without risky substitutions.

Use stock when:

  • The exact grade, condition, length, and certificates are available.
  • Dimensions and tolerances meet the drawing.
  • Cutting, drilling, forming, and finishing have enough process margin.
  • The size does not force changes to clearances, joints, or enclosure space.

Consider custom material or fabrication when:

  • Stock would create excessive machining or waste.
  • A special thickness, profile, bend, or controlled edge is required.
  • Hole patterns and interfaces have little tolerance with the nearest stock size.
  • Validation depends on the exact released cross-section.

Project example: A buyer selects a 50 × 5 mm bar because its 250 mm² area fits an early calculation. During integration review, it blocks connector tool access and leaves too little space around an offset terminal. Changing to a narrower, thicker bar may solve the space problem but alter bending, cooling, and joint geometry. The safer next step is to compare validated options, update the mechanical stack, and release one controlled drawing before quotation.

Why integrated review matters: A busbar and PCB can each pass an isolated drawing check and still fail together. Hole patterns must align; bends and thickness must fit the enclosure; contact areas must match the assembly process; and installers need access for hardware, soldering, inspection, and rework.

How EBest Circuit supports the handoff: Our team can review the released busbar and PCB manufacturing interfaces in one quotation package, then connect that review with PCB fabrication, component-sourcing support, PCBA, inspection planning, and agreed testing coordination. We will flag unclear inputs and state the proposed scope instead of quietly making design assumptions. This gives your team a clearer decision record while electrical design, system safety, and final approval remain under your control.

Send these RFQ files:

  • Released 2D drawing and a matching 3D model when the part is formed.
  • Material, finish, masking, certificate, and quantity requirements.
  • Critical dimensions, datums, tolerances, and inspection expectations.
  • Customer-approved ratings, test inputs, and acceptance limits.
  • PCB files, BOM, assembly interfaces, revision, and delivery target.

Send the controlled package, not a screenshot of a size table. Email the files and required scope to sales@bestpcbs.com; our team will review what is ready, identify what still needs confirmation, and help you define the next manufacturing step.

North American Charging Equipment PCB and Busbar Project

Standard copper busbar sizes

A North American customer needed 500 PCBs for charging equipment within a one-week lead time. EBest Circuit manufactured and delivered the order to these released PCB requirements:

  • 2-layer FR-4 with Tg 130°C.
  • 1 oz finished copper and 1.6 mm finished board thickness.
  • Green solder mask and white silkscreen.
  • HASL surface finish.
  • Routed and delivered as individual boards rather than panels.

The board was used in a charging-equipment assembly with a rectangular copper busbar interface. The customer’s drawings controlled the busbar width, thickness, copper grade, finish, and current rating; the PCB’s 1 oz copper was not treated as the main current path.

To meet the one-week schedule, our team checked the PCB stack-up, drill and outline data, individual-board routing, busbar mounting holes, terminal geometry, electrical clearances, and fastener access under one revision. The 500 boards were fabricated, routed, inspected, and packed as individual pieces.

This case shows the value of sending the PCB files and controlled busbar drawing together. EBest Circuit can review the interfaces, produce the PCB, and support sourcing and PCBA when required, while the customer retains control of electrical ratings and final design approval.

FAQs About Standard Copper Busbar Sizes

Is there one universal list of standard copper busbar sizes?

No. “Standard” usually reflects recurring supplier stock. Available combinations differ by region, grade, thickness, temper, and quantity, so confirm availability before release.

Should dimensions be written as width × thickness?

Metric tables often use width × thickness, while some imperial references list thickness × width. Label the dimensions and units on the drawing to prevent reversal.

Can two bars with the same cross-sectional area carry the same current?

Not automatically. Shape, orientation, enclosure, temperature rise, spacing, joints, and surface condition can change performance. Validate the actual assembly.

Is C11000 the only copper grade used for busbars?

No. C11000 is common, but ASTM B187/B187M lists several copper UNS designations for electrical applications. Specify the required grade or approved alternatives.

What should be sent with a copper busbar RFQ?

Send the released drawing, material and finish, quantities, tolerances, inspection needs, approved ratings, assembly interfaces, revision, and delivery target.

If your busbar must align with a PCB, terminals, enclosure, or power assembly, we would be glad to look at the manufacturing package with you. Send the released files, BOM, quantities, and acceptance requirements to sales@bestpcbs.com. The EBest Circuit (Best Technology) team will point out missing quotation inputs and help define a practical PCB/PCBA, inspection, and agreed testing scope before production.

Use this guide to review Standard copper busbar sizes, then send your released PCB, busbar, BOM, quantity, and acceptance requirements to sales@bestpcbs.com.

You may also like

How to Prevent ESD Electrostatic Discharge in Electronics?

August 10th, 2026

Electrostatic discharge can damage an electronic component in far less time than a person can react. The event may produce a visible spark, but it can also occur without any sound, light, or immediate failure. A device may stop working at once, drift outside its electrical limits, or pass an initial test and fail prematurely in service. Effective prevention therefore cannot depend on whether an operator notices a shock.

The practical answer to how to prevent ESD electrostatic discharge in electronics is to control charge throughout the complete handling route. Keep personnel, tools, work surfaces, and equipment at a common electrical potential; remove avoidable charge generators; neutralize essential insulators; and enclose exposed electronics before they leave an ESD-protected area. A wrist strap, mat, or shielding bag works only as part of this connected system.

ESD-safe electronics workbench with a circuit board in a protective tray and a grounding wrist strap

What Is ESD and Why Is It Dangerous to Electronics?

ESD stands for electrostatic discharge: a rapid transfer of charge between objects at different electrical potentials. Static charge can accumulate on a person, cart, plastic tray, garment, tool, or device. When a charged object approaches or makes contact, the potential difference may drive a brief current pulse. That pulse can pass through a semiconductor junction, connector pin, PCB trace, or test point.

The voltage that a person can feel is not a useful pass-or-fail threshold for electronics. Sensitive devices can be affected by discharges below the level of human perception. The resulting damage can be catastrophic, meaning the part fails immediately, or latent, meaning the device is weakened but still appears functional. Latent damage is particularly difficult because ordinary inspection may not reveal it and a basic functional test may not exercise the degraded structure under worst-case conditions.

Prevention must cover both the bare component and every assembly stage in which its conductive contacts remain exposed. A component may be protected in its supplier packaging, then become vulnerable when unpacked, placed on a feeder, manually soldered, moved to inspection, connected to a tester, or transferred into final packaging. The control boundary must follow the item through those transitions.

What Causes Electrostatic Discharge in Electronic Environments?

ESD risk begins when a process generates or moves charge close to exposed electronics. The operator should trace the complete route—from package opening to assembly, testing, storage, and shipment—because a safe bench cannot protect a board during an uncontrolled handoff.

  • Contact and separation: Walking, peeling protective film, pulling tape, sliding bins, and removing boards from ordinary foam can cause triboelectric charging. Reduce unnecessary friction and use qualified work surfaces, containers, and packaging.
  • People and clothing: Shoes, chairs, synthetic garments, and loose sleeves can generate and retain charge. Use the personnel-grounding method and garments defined for the work area, and keep clothing away from exposed contacts.
  • Insulators and induction: A charged plastic object can redistribute charge in a nearby conductor without touching it. Remove unnecessary insulators; where one is essential, assess its field at the product position and use verified ionization when needed.
  • Movement and handoffs: Carts, cables, tools, trays, and packaging may introduce a new charge source between workstations. Map every transfer point and close protective packaging before a board leaves the protected environment.

Dry air can allow charge to remain longer, but humidity alone does not make the route safe. Before handling begins, identify the charge generators, conductive paths, exposed pins or pads, and the next location the product will enter.

How Can You Prevent ESD Before Handling Electronic Components?

Preparation is the first control. Many preventable ESD events occur during unpacking or the first transfer because the item is exposed before the area, operator, and destination container are ready. Keep the package closed while you identify the item, prepare the controlled work area, and confirm where the item will be placed if work stops unexpectedly.

Use a deliberate handling sequence:

  1. Identify ESD sensitivity: check the label, component specification, assembly drawing, or process instruction for the required handling level and packaging. If sensitivity is unknown, do not treat the item as ordinary hardware; keep it protected until the responsible technical owner confirms the controls.
  2. Choose the handling area before unpacking: move the sealed package to an approved workstation or ESD protected area. Prepare an approved tray or work surface large enough for the item so it will not be placed temporarily on a chair, carton, ordinary bench, or the outside of its packaging.
  3. Verify personnel and workstation grounding: test the wrist strap or footwear system required for the operation, check the work-surface connection, and respond to any continuous-monitor alarm. A connected cord is not proof of performance; use the specified tester and acceptance criteria.
  4. Remove or control charge generators: clear ordinary plastic, foam, tape, document sleeves, loose synthetic fabric, and personal items from the immediate area. If an insulating tool, cover, or fixture is essential, position and control it according to the process plan, using verified ionization when required.
  5. Open the package only after every destination is ready: do not slide the board across the bag, tray, or work surface. Never place an exposed assembly on the outside of a shielding bag. Preserve reusable packaging so the item can be protected immediately if the task is interrupted.
  6. Handle the item through safe mechanical points: hold boards by their edges and avoid connector contacts, component leads, pads, test points, and exposed conductive areas. Use approved tools or board supports when the item cannot be held securely, and avoid unnecessary hand-to-hand transfers.
  7. Repackage before any uncontrolled transfer: return the item to a suitable closed package before moving it to storage, another department, or a non-EPA location. Keep the ESD identification visible and ensure the next person knows where the package may be opened.

Electrical safety remains separate from ESD control. Disconnect power and stored-energy sources when the service procedure requires it, but remember that de-energizing equipment does not automatically establish an approved ESD grounding path. Never improvise a connection to an unknown conductor. Use approved grounding hardware and follow the equipment safety procedure; an ESD control measure must not create a shock or equipment hazard.

How Do You Ground Yourself and an ESD Workstation Correctly?

Grounding gives conductive objects and personnel a controlled path toward a common electrical potential. The goal is to connect the operator, work surface, approved conductive fixtures, and designated grounding point through a system that can be tested before sensitive electronics are exposed. Apply this approach according to how the work is performed:

  • For seated work, use continuous wrist-strap grounding. Fit the band against bare skin, connect the cord to the designated grounding point, and test the complete strap-and-cord assembly according to the control plan. A loose band worn over clothing or a disconnected cord provides no dependable protection.
  • For standing or mobile work, verify the footwear-and-flooring system. Performance depends on the complete path through the footwear, floor, ground connection, and person. Dirt, unsuitable shoes, worn components, or poor maintenance can break that path; conductive flooring alone is not proof of personnel grounding.
  • Connect the workstation through a documented common-point or equipotential scheme. Include the ESD work surface, personnel grounding point, metal fixtures, and applicable equipment chassis. Avoid improvised daisy chains, unverified outlet connections, and clips attached to painted or insulated surfaces.
  • Verify the system before exposing sensitive electronics. Use the tester and acceptance criteria specified by the ESD control plan. Visual inspection can find a disconnected lead, but it cannot confirm the electrical performance of the complete grounding path.

Which ESD Protection Tools and Materials Should You Use?

ESD products are not interchangeable. Select each control by the mechanism it must address and by the sensitivity of the item being handled.

Control Use it for Check before relying on it
Wrist strap and cord Continuously grounds a seated operator Must fit, contact skin, connect correctly, and pass verification
ESD work surface Provides a controlled surface and charge-dissipation path Requires correct installation, cleaning, and resistance checks
Footwear and ESD floor Grounds personnel during standing or mobile work Performance belongs to the complete footwear-floor system
Ionizer Neutralizes charge on essential insulators Does not replace grounding for conductors and requires performance checks
Shielding bag or container Protects an ESDS item during storage or movement outside a controlled area Protection depends on material function, closure, condition, and correct use
Field meter or field indicator Locates electrostatic fields and charged objects Must be used at the specified distance and does not replace resistance testing
Resistance meter and electrodes Checks work surfaces, floors, and other control items Method, electrodes, voltage, environment, and acceptance limits must match the procedure

Terms such as antistatic, conductive, dissipative, and shielding describe different behaviors. An item marketed as “anti-static” may reduce charge generation but may not shield a sensitive device from an external discharge. Purchase and inspection specifications should state the required protective function and the applicable test method rather than relying on color or a generic ESD label.

How Do Humidity, Clothing, and Insulators Affect ESD Risk?

Humidity, clothing, and insulators change ESD risk, but none replaces a verified grounding system. Treat them as distinct variables and check their effect at the place where the electronics are actually exposed.

  • Track seasonal humidity: Dry air often increases charge retention. Record conditions during measurements and investigate controls that pass in one season but fail in another; do not use added humidity as the only safeguard.
  • Control garments near the product: Synthetic fabric, loose sleeves, and clothing layers can generate charge or interfere with grounding. Wear specified ESD garments correctly fastened and keep ordinary clothing from reaching over exposed boards.
  • Remove avoidable insulators: Ordinary plastic, glass, tape, and foam cannot be discharged through a ground wire in the same way as a conductor. Relocate nonessential materials beyond the defined working distance.
  • Verify essential ionization: When an insulator is necessary, use verified ionization to neutralize its charge. Measure balance and charge-decay performance at the product position under normal airflow and obstruction conditions. Define cleaning intervals, acceptance limits, and the response to a failed check.

How Can You Prevent ESD During PCB Assembly, Repair, and Testing?

PCB secured in a grounded ESD-safe assembly and inspection workstation

PCB and PCBA operations create repeated transitions between packaging, machines, fixtures, people, and test equipment. The control plan must cover the complete route rather than a single bench. Apply the controls at each production stage:

  • Receiving and kitting: verify the ESD label and package condition before opening, then move parts to approved trays or containers. Keep moisture and ESD controls distinct because a moisture-barrier bag and an ESD shielding package may address different risks. Do not pour components into ordinary plastic bins or place cut tape on an uncontrolled surface.
  • SMT preparation and manual assembly: include feeders, carts, racks, splice tools, setup benches, board supports, soldering equipment, and personnel grounding in the ESD assessment. Confirm the required controls before exposing components, and handle boards by their edges whenever the process permits.
  • Repair and rework: define protected locations for replacement devices, removed components, suspect boards, and accepted boards. Keep microscopes, extraction equipment, fixtures, tools, and nearby materials within the control plan. A grounded operator cannot compensate for an ungrounded fixture or charged plastic beside the repair area.
  • Inspection and testing: include fixtures, cables, probes, adapters, power supplies, and communication interfaces in the equipotential and verification strategy while maintaining electrical-safety requirements. Factory handling controls do not replace circuit-level immunity design; protection components, current paths, interfaces, layout, and product testing are covered separately in the guide to PCB ESD protection.
  • Documentation and handoffs: keep assembly drawings, handling instructions, travelers, test procedures, packaging specifications, and nonconformance records consistent about item classification and required controls. Within the broader PCB manufacturing and assembly process, specify ESD handling at every transfer point instead of treating it as a final packing step.

How Should ESD-Sensitive Parts Be Stored and Transported?

Assembled circuit board in a dissipative tray beside open and sealed ESD shielding bags

Outside an ESD-protected area, closed protective packaging is the primary defense. Select it for the journey and the product’s sensitivity, not by bag color or a generic “antistatic” label.

  • Match protection to the route: Internal movement, warehouse storage, and commercial shipment expose a board to different people, surfaces, fields, and mechanical loads. Specify the needed combination of low charge generation, dissipation, and shielding for each route.
  • Close before crossing the boundary: Seal the bag or container while still inside the approved handling location. An open bag beside a board provides no dependable shielding during movement.
  • Inspect before reuse: Reject bags, foam, trays, or totes with punctures, contamination, worn surfaces, broken closures, or uncertain material identity. Preserve labels and lot or serial traceability.
  • Control both opening and repacking: At receiving, move the closed package to an approved location before opening it. At final packing, immobilize the board, protect exposed connectors, and prevent accessories or documents from compromising the protective layer.

Ordinary bubble wrap, household bags, and loose foam should not contact exposed ESD-sensitive parts unless their suitability has been established. The protection remains effective only while its specified functions and closure stay intact.

How Do You Test and Maintain an ESD Control Program?

An ESD program is a maintained control system, not a one-time workstation purchase. Effective factory protection combines environmental controls, personnel training, and ongoing management. Use the following six steps to keep the program measurable and effective:

  1. Define the control plan and acceptance limits: identify which components and assemblies are ESD-sensitive, where they may be exposed, who owns each control, and which test method applies. The plan should cover protected-area boundaries, personnel grounding, work surfaces, floors, ionizers, tools, packaging, training, records, and corrective action. A device or workstation cannot be judged as passing unless the applicable limit and test method are defined before measurement.
  2. Perform operator checks before handling begins: test wrist straps, footwear systems, or continuous monitors at the frequency required by the plan. Confirm that cords, bands, ground connections, alarms, and workstation status are usable before opening protective packaging. Record a failed check and prevent the person or station from handling exposed ESDS items until the required control passes.
  3. Schedule measurements for fixed and process equipment: measure work surfaces, floors, carts, racks, fixtures, soldering equipment, and other control items according to their risk and qualification method. Check ionizers at the actual use position for the required balance and charge-decay performance. Repeat verification after relocation, repair, maintenance, material substitution, or a process change that could alter the grounding path or electrostatic field.
  4. Control instruments and retain usable records: use equipment suitable for the measurement range and keep its calibration or verification status current. Each record should identify the item, location, method, instrument, environmental conditions when relevant, result, acceptance limit, date, and person performing the check. A simple pass mark without the measured result or applicable limit is weak evidence when a failure must be investigated later.
  5. Audit the complete material flow: extend ESD training and auditing to receiving, storage, kitting, assembly, rework, inspection, testing, packaging, laboratories, and field activities. Observe actual transfers instead of reviewing documents alone. Confirm that visitors and temporary personnel follow access rules, protective packaging remains closed outside ESD-protected areas, and trained personnel know how to respond when a control fails.
  6. Contain failures and verify corrective action: stop exposing sensitive items where a required control has failed, identify the time window and material that may have been affected, and restore the control. Evaluate affected products using the approved disposition process rather than assuming that a normal visual or functional check proves no damage. Record the cause, correction, responsible owner, due date, and recheck result before closing the issue.

What ESD Prevention Checklist Should You Follow?

Use this concise checklist before touching or moving ESD-sensitive electronics:

  1. Confirm sensitivity: identify the item as ESD-sensitive and read its handling requirements.
  2. Keep packaging closed: do not open the protective package before it reaches the approved work area.
  3. Remove charge generators: clear ordinary plastic, foam, tape, and other unnecessary materials.
  4. Verify the grounding path: check both the workstation ground and the required personnel grounding system.
  5. Use approved controls: select suitable work surfaces, tools, fixtures, trays, and containers.
  6. Control insulators: remove nonessential insulators or neutralize essential ones with verified ionization.
  7. Handle by safe edges: avoid contacts, leads, pads, and test points on components and boards.
  8. Protect every operation: maintain ESD controls during assembly, rework, inspection, and testing, not only during soldering.
  9. Package before movement: close suitable protective packaging before storage or transport outside the controlled area.
  10. Stop after a failed check: record the result and do not continue while a critical control is out of specification.
  11. Investigate suspected exposure: review damaged packaging or uncontrolled transfers before releasing affected material.
  12. Review and reverify: audit the complete process periodically and confirm corrective actions after changes.

A practical summary of how to prevent ESD electrostatic discharge in electronics follows six actions. Identify sensitivity, control the area, ground conductors, neutralize essential insulators, protect the item during movement, and verify every safeguard. Skipping one of these actions can leave sensitive hardware exposed.

FAQs About Preventing Electrostatic Discharge (ESD)

Q1: Can a powered-off component still be damaged by ESD?

A1: Yes, powered-off components remain vulnerable to ESD. Removing operating power does not protect semiconductor junctions or exposed contacts. Apply the same handling precautions to powered-off parts and unpowered assemblies.

Q2: Do disposable nitrile gloves replace ESD grounding?

A2: No, ordinary nitrile gloves do not provide a verified grounding path. Gloves may also affect charge generation, so use them only when the process requires them and retain the approved personnel-grounding method.

Q3: Is a wooden workbench safe for ESD-sensitive electronics?

A3: A wooden bench is not ESD-safe by default. Its electrical behavior changes with coatings, contamination, wear, and humidity. Use a qualified ESD work surface with a defined ground path and measurement limits.

Q4: Can ESD damage be repaired?

A4: Latent ESD damage can be difficult to locate or prove absent. A failed component may sometimes be replaced, but suspect material should be quarantined and investigated under the product’s disposition procedure rather than released after only a quick functional test.

Q5: Can ESD shielding bags be reused?

A5: Reuse a shielding bag only when the approved procedure allows it. The bag must remain clean, identifiable, undamaged, and able to close correctly. Replace it after puncture, severe creasing, contamination, or uncertain history.

Q6: Can visitors enter an ESD-protected area?

A6: Visitors may enter only under the site’s controlled-access rules. They may need training or an escort, the same personnel-grounding checks as operators, and restrictions on personal items and clothing.

Q7: Can batteries or powered assemblies go into conductive packaging?

A7: Do not select packaging by ESD properties alone. Exposed energy sources can create a short-circuit or safety hazard, so follow the product-specific packaging method and insulate terminals where required.

Q8: What should happen after a continuous monitor alarm?

A8: Stop exposing sensitive hardware immediately. Protect or close the material, identify the failed connection or equipment, record potentially affected work, and resume only after the system passes verification.

Q9: Who should own an ESD control program?

A9: Assign a named ESD coordinator and accountable process owners. Responsibilities should cover production, maintenance, quality, training, and corrective action because failures often cross departmental boundaries.

Q10: When should an ESD risk assessment be repeated?

A10: Reassess ESD risk before a changed process becomes routine. Repeat the assessment after changes to products, layouts, materials, equipment, packaging, environmental conditions, or handling routes, and after unexplained failures.

Conclusion

Preventing ESD in electronics requires more than avoiding visible sparks. Effective protection starts before a package is opened and continues through assembly, repair, testing, storage, and transport. Ground conductors and personnel through approved systems. Neutralize charge on essential insulators, protect exposed hardware outside controlled areas, and correct failed checks before work resumes.

Need reliable PCB fabrication or assembly support with clearly defined ESD handling requirements? Contact EBest Circuit and send your Gerber/ODB++, BOM, quantity, stackup, assembly, programming, and test requirements to sales@bestpcbs.com.

You may also like

How to Choose Electronic Components for PCB Design?

August 6th, 2026

For an electronic components PCB project, choose parts by translating product requirements into electrical, thermal, mechanical, manufacturing, and supply-chain limits. The right part must perform its circuit function, fit a verified land pattern, survive the real environment, remain sourceable, and pass prototype and production validation. A part number is acceptable only when every one of those conditions is documented.

Do not begin by searching for the cheapest IC or the smallest package. Begin with a requirements sheet, select the main functional devices, derive their support circuits from current manufacturer documents, and then evaluate ratings, package constraints, availability, and verification evidence. The following sequence keeps component decisions connected to PCB layout and PCBA production instead of treating the BOM as a purchasing list created after design.

Electronic Components PCB selection workbench with an assembled circuit board and organized component trays

What Requirements Should You Define Before Choosing Electronic Components for PCB Design?

Define the operating envelope before selecting any manufacturer part number. A concise component requirements sheet should state what the circuit must do and the conditions under which it must do it. Without this baseline, a component can look suitable in a parametric search while failing on startup current, logic compatibility, enclosure temperature, lifetime, or assembly constraints.

Requirement Area Questions to Resolve Component Decision Affected
Function and interfaces What must be sensed, processed, switched, stored, driven, or communicated? Main IC, analog front end, driver, memory, protection, and connector family
Power What are the nominal, startup, transient, fault, and sleep conditions? Regulators, MOSFETs, diodes, inductors, capacitors, fuses, and current-sense parts
Environment What are the ambient temperature, humidity, vibration, contamination, and altitude limits? Temperature grade, package, sealing, corrosion risk, creepage, and coating compatibility
Mechanical envelope What are the board outline, height limits, connector positions, mounting loads, and service needs? Package height, connector style, retention, heatsink, and keepout requirements
Production What volume, assembly process, inspection method, and repair strategy will be used? Package pitch, termination visibility, tape-and-reel option, moisture sensitivity, and test access
Compliance and lifetime Which market, safety, substance, automotive, industrial, or customer requirements apply? Qualification grade, declarations, traceability, lifecycle status, and approved sources

Rank each requirement as mandatory, target, or optional. Also record the source of the value: system specification, interface standard, safety analysis, mechanical model, test requirement, or customer contract. This prevents a desirable feature from being mistaken for a release condition and gives reviewers a clear reason for accepting or rejecting a candidate.

How Do You Select the Main Electronic Components for the Required PCB Function?

Select the architecture first and the exact orderable device second. The main IC must cover the required function with enough processing, interfaces, analog performance, memory, protection, and power capability, but unused features add cost, power, routing difficulty, and software risk.

  • Match the essential function: List required channels, resolution, bandwidth, timing, memory, communication interfaces, and control features before comparing product families.
  • Check system compatibility: Confirm supply rails, input thresholds, output drive, clocking, startup state, reset behavior, and communication voltage levels.
  • Assess implementation burden: Include firmware maturity, programming tools, reference software, external memory, calibration, and required analog support.
  • Compare usable packages: A device available only in a package that cannot be routed, inspected, reworked, or thermally managed is not a practical choice.
  • Evaluate failure behavior: Determine what happens during undervoltage, overcurrent, loss of communication, overheating, open sensors, and shorted loads.

A functional block diagram is useful at this stage. Assign one owner component to each major block, then record the assumptions that connect the blocks. This exposes missing level translators, isolation, protection, clock sources, interface transceivers, and power rails before the schematic becomes difficult to change.

How Do Datasheets Define the Support Components Around a Main PCB Device?

Use the current datasheet, reference design, and application notes to build each support network. Do not copy only the typical application drawing: check the surrounding equations, operating conditions, layout notes, component tolerances, and package-specific requirements.

For a power converter, calculate the inductor, input and output capacitors, feedback network, compensation, diode or synchronous switch requirements, current sense, and thermal loss using the actual input range and load profile. For a processor, review every supply domain, decoupling group, reset and boot pins, crystal or clock network, programming interface, pull resistors, and unused-pin instructions. Manufacturer guidance may also make placement part of the electrical requirement; for example, high-frequency decoupling capacitors often need a very short connection to the pin and return path.

  1. Freeze the document revision: Record the datasheet revision, errata, application notes, package drawing, and reference design used for selection.
  2. Extract mandatory networks: Separate required components from optional performance-tuning or evaluation-board features.
  3. Recalculate for the application: Replace example voltages, currents, frequency, temperature, and load assumptions with project values.
  4. Transfer layout constraints: Add placement, loop-area, grounding, thermal-via, and routing requirements to the PCB design rules.
  5. Record validation items: Identify values that must be tuned or confirmed during prototype measurement.

Which Electrical Ratings and Tolerances Matter for PCB Component Selection?

Compare worst-case circuit stress with the component’s guaranteed operating limits, not just its headline rating. Absolute maximum ratings describe a damage boundary, not a recommended continuous operating point. Use the recommended operating range and verified application conditions for normal design.

Component Parameters to Check Often-Missed Effect
Resistor Resistance, tolerance, rated power, working voltage, pulse rating, TCR A small resistor may meet average power but fail a startup or surge pulse
MLCC Capacitance, tolerance, voltage, dielectric, temperature range, ESR Effective capacitance can fall under DC bias, temperature, and aging
Inductor Inductance, tolerance, saturation current, RMS current, DCR, self-resonant frequency Peak current can cause saturation before average-current heating becomes excessive
Diode Reverse voltage, forward current, surge current, forward drop, leakage, recovery Leakage and reverse recovery can dominate high-temperature or switching behavior
MOSFET VDS, ID, RDS(on) at actual gate voltage, gate charge, SOA, thermal resistance A headline current rating may assume a thermal condition unavailable on the real PCB
IC Supply range, I/O limits, accuracy, timing, power, junction temperature Electrical performance may be guaranteed over a narrower range than basic operation
Connector Current per contact, voltage, contact resistance, cycles, wire size, temperature rise Total current and adjacent loaded contacts can reduce usable current per pin

Use worst-case analysis for tolerance stacks. A divider, filter, oscillator, current limit, feedback loop, and sensor channel can all fail even though every nominal value appears correct. For capacitors, use the manufacturer’s effective-capacitance data at applied voltage and temperature; a power-supply design that needs 10 µF cannot assume that a part marked 10 µF provides that value in circuit.

How Do Derating, Temperature, and Environment Affect Electronic Components?

Derating must follow the real stress mechanism and the component manufacturer’s conditions. A single blanket percentage is not valid for every resistor, capacitor, semiconductor, connector, or application. Establish maximum circuit stress, include tolerances and transients, calculate temperature rise, and then apply the project reliability policy.

Thermal analysis must connect the component package to the board. Power dissipation, copper area, thermal vias, airflow, neighboring heat sources, enclosure temperature, and duty cycle determine junction or hot-spot temperature. Manufacturer thermal parameters are tied to stated test boards and conditions; they are not universal package constants.

Environmental selection also covers humidity, condensation, corrosive gases, salt, vibration, shock, UV exposure, cleaning chemistry, and conformal-coating compatibility. Temperature grade alone does not prove that a device, termination finish, connector seal, or solder joint is suitable for the complete environment.

How Do PCB Component Packages, Footprints, Pinouts, and Assembly Processes Affect Selection?

A component is not PCB-ready until its exact package code and land pattern have been verified together. Similar family names can hide differences in body size, pitch, exposed pad, pin numbering, lead finish, package height, or thermal behavior.

  • Verify the package drawing: Match the orderable suffix to the manufacturer’s outline drawing, pin-one marker, terminal dimensions, pitch, coplanarity, and exposed-pad definition.
  • Build the land pattern deliberately: Use manufacturer and applicable IPC guidance, then adapt solder-mask, paste, courtyard, and via rules to the assembler’s process capability.
  • Check assembly access: Confirm pick-and-place packaging, nozzle access, component clearance, polarity visibility, AOI view, X-ray need, rework access, and hand-solder limitations.
  • Review moisture handling: Record moisture-sensitivity and floor-life controls for packages that require dry storage or baking decisions.
  • Test the library model: Compare symbol pins, footprint pads, 3D model, courtyard, and BOM package field against the same manufacturer document.

Fine-pitch and bottom-terminated packages can reduce area and electrical parasitics, but they increase stencil, voiding, X-ray, routing, and rework demands. NXP’s package guidance, for example, treats land pattern, solder mask, paste, vias, thermal transfer, and assembly as a connected system rather than independent library fields. The decision should therefore involve both PCB layout and the intended assembly process.

How Do Signal Integrity, Power Integrity, and EMC Affect PCB Component Selection?

Choose components using the electrical behavior of the complete interconnect, not isolated datasheet functions. Edge rate, impedance, parasitics, return-path continuity, loop area, current slew, and placement can make two functionally similar parts behave differently on the PCB.

For high-speed interfaces, check actual I/O standards, rise and fall times, output drive options, termination needs, package escape, clock jitter, connector bandwidth, and protection-device capacitance. For power integrity, check load transients, regulator control response, capacitor impedance versus frequency, bias-reduced capacitance, plane resistance, and anti-resonance risk. For EMC, select protection and filtering parts whose voltage, energy, current, capacitance, leakage, and frequency behavior fit both the interface and the expected disturbance.

Placement-sensitive components belong in the same decision as the main device. A decoupling capacitor with a suitable nominal value but excessive connection inductance may not suppress high-frequency current demand. Likewise, a TVS diode with excessive capacitance can degrade a fast data link even if its surge rating is adequate.

Which Reliability, Compliance, and Quality Requirements Apply to PCB Components?

Translate product-level obligations into component-level evidence before approving the BOM. Required evidence may include temperature grade, qualification status, material declarations, flammability information, traceability, change-notification support, and customer-specific approval.

Qualification labels must be read precisely. An IC qualified to AEC-Q100 is not the same as a complete automotive product approval. Confirm the exact part number, qualification revision, temperature grade, manufacturing site coverage, and applicable test group.

Similarly, assembly acceptance and soldering requirements are not substitutes for component selection. IPC identifies IPC-A-610 as an assembly acceptability standard used with J-STD-001; these documents can shape inspection requirements, but they do not prove that an electrical rating, package choice, or supplier source fits the application. Keep product compliance, component qualification, and assembly workmanship as linked but separate records.

How Does Electronic Component Selection Change from PCB Prototypes to Mass Production?

Prototype parts prove the design concept; production parts must also prove repeatability, process fit, and supply continuity. A development board, hand-soldered package, tray-packed sample, or broker-sourced device may be useful during learning but unsuitable for a controlled production release.

Decision Prototype Priority Production Priority
Availability Obtain enough parts quickly for learning Confirm authorized channels, lead time, allocation risk, and repeat-order continuity
Package May favor accessible pins or adapter boards Must match automated placement, inspection, rework, density, and thermal targets
Cost Unit price has limited impact at low quantity Evaluate total landed cost, placement cost, yield risk, inventory, and lifecycle
Testing Bench measurements and engineering access Defined programming, inspection, electrical test, functional test, and traceability
Documentation Working notes may change rapidly Released schematic, PCB, BOM, centroid, firmware, drawings, and test revision must agree

Before a pilot build, remove evaluation-only substitutions, verify reel orientation and packaging quantity, establish incoming-inspection criteria, review programming and calibration time, and freeze the design records. Feed measured prototype current, temperature, noise, startup, EMC, and tolerance results back into final ratings rather than treating a functioning bench unit as production proof.

How Should Availability, Lifecycle, Cost, and Second Sources Shape the PCB BOM?

Optimize the BOM for continuity and total production risk, not the lowest quoted unit price. Check lifecycle status, authorized availability, lead time, minimum order, packaging, price breaks, change-notification access, and realistic alternatives while the schematic can still change.

Prefer active parts with clear manufacturer support for new designs. Treat active, not recommended for new designs, last-time-buy, and obsolete as different procurement states rather than reducing them to “available” or “unavailable.” Monitor PCNs and discontinuance notices for critical devices throughout the product life.

Second sourcing is easiest for standardized passives and difficult for complex ICs, sensors, magnetics, connectors, and displays. When pin-compatible alternatives do not exist, consider footprint options, stuffing variants, or an alternate circuit architecture during design. A controlled component sourcing review should flag single-source, allocated, obsolete, unusually long-lead, or authenticity-sensitive items before production commitments are made.

How Should PCB Component Substitutes and BOM Revisions Be Controlled?

No substitute should enter production on description, package name, or pin compatibility alone. Compare form, fit, and function, then validate every parameter that can affect performance, safety, firmware, PCB layout, assembly, inspection, and sourcing.

PCB component substitutes in separate antistatic trays beside a reference circuit board and revision document
  • Confirm identity: Compare exact manufacturer part numbers, suffixes, package drawings, pinout, polarity, markings, and packing format.
  • Compare electrical limits: Review operating range, accuracy, timing, leakage, noise, transient response, protection, and worst-case tolerances.
  • Compare physical behavior: Check body and terminal dimensions, height, mass, thermal pad, solderability, MSL, and land-pattern compatibility.
  • Assess implementation impact: Identify firmware, calibration, register, boot, initialization, EMC, or test-limit changes.
  • Qualify the change: Define sample inspection, bench tests, thermal checks, functional tests, compliance regression, and pilot-build evidence proportionate to risk.
  • Release one revision: Update the approved vendor list, BOM, schematic notes, PCB variant, assembly drawing, firmware, test specification, and change record together.

Major manufacturer changes may be communicated through product change notifications when they affect form, fit, function, quality, or reliability. Treat each notice as an engineering input: identify affected products, decide whether requalification is needed, record approval, and prevent purchasing from silently mixing unapproved revisions.

How Do You Verify Electronic Components Before PCB Release?

Release the BOM only after schematic, library, procurement, manufacturing, and test evidence agree. Verification should be a documented review with named inputs and outcomes, not a final visual scan of the part numbers.

Engineer verifying PCB component packages and solder joints under a stereo microscope before release
  1. Audit requirements: Trace every critical voltage, current, timing, thermal, environmental, compliance, and lifetime requirement to a component decision.
  2. Review datasheets: Confirm current revisions, orderable suffixes, recommended operating limits, errata, support networks, and layout instructions.
  3. Validate libraries: Cross-check symbol pins, electrical types, footprint pads, pin one, exposed pads, courtyard, height, and 3D clearance.
  4. Run worst-case checks: Calculate rating margin, tolerance stacks, losses, junction temperature, startup stress, transient energy, and effective capacitance.
  5. Review DFM and DFA: Confirm the package, land pattern, solder mask, paste, spacing, orientation, inspection, X-ray, rework, and panel-process needs.
  6. Review sourcing: Check status, authorized supply, lead time, MOQ, packing, traceability, PCN access, and approved substitutes.
  7. Align release files: Ensure schematic, PCB database, BOM, approved vendor list, centroid data, assembly drawing, firmware, and test plan use the same revision.
  8. Define prototype evidence: Plan measurements for rails, current, temperature, clocks, interfaces, transients, noise, EMC pre-compliance, and functional boundaries.

The approved design database and BOM should remain the source of truth; photographs or package resemblance are not reliable substitutes. For related guidance on maintaining values, manufacturer part numbers, packages, designators, alternates, and assembly data, see the PCB parts list workflow. Revisit the electronic components PCB selection process whenever requirements, layout, firmware, supplier, or production conditions change.

FAQs About Electronic Components PCB

Q1: Should every PCB component have a manufacturer part number?

A1: Production BOM lines should specify an exact orderable manufacturer part number. Generic values may be acceptable only when the controlled procurement specification defines all permissible ratings, packages, materials, and approved manufacturers.

Q2: Can I use the absolute maximum rating as the normal design value?

A2: No; design within the recommended operating conditions. Absolute maximum ratings are damage boundaries, not intended operating points, so include tolerance, transient, thermal, and reliability margin.

Q3: Is a pin-compatible IC automatically a safe substitute?

A3: No; require a form-fit-function comparison and risk-based validation. Pin compatibility does not prove matching logic thresholds, timing, analog performance, startup behavior, thermal limits, firmware registers, package geometry, or qualification.

Q4: Should I choose the smallest available component package?

A4: The smallest package is not always the lowest-risk production choice. Use it only when routing, thermal performance, placement, inspection, rework, and supplier capability support it.

Q5: What information should an approved component record contain?

A5: The record must provide unambiguous identity and revision control. Include the exact part number, manufacturer, description, value, ratings, tolerance, package, lifecycle, declarations, approved source, datasheet revision, alternates, and approval evidence.

Q6: How many alternative components should be approved?

A6: There is no universal number of approved alternatives. Qualify them where supply risk justifies the effort; a critical single-source item may need an architectural contingency, while common passives may support multiple prequalified sources.

Q7: Can prototype components be purchased from any available seller?

A7: Prefer authorized, traceable sourcing appropriate to the product risk. Development needs do not remove authenticity risk, so document any exception and avoid using uncertain parts for qualification or production decisions.

Q8: When should component selection be frozen?

A8: Freeze the production BOM only after all release evidence agrees. Requirements, schematic, footprint, worst-case analysis, DFM, sourcing, prototype results, and test plans must align; later changes require formal engineering change control.

Q9: Does RoHS status prove that a component meets all compliance needs?

A9: No; verify each applicable compliance obligation separately. RoHS addresses restricted substances within its scope, not electrical safety, automotive qualification, EMC performance, reliability, or end-product suitability.

Q10: What files should be sent to a PCBA supplier for component review?

A10: Send a complete, revision-aligned manufacturing data set. Include the released BOM, Gerber or ODB++, centroid file, assembly drawings, schematic when permitted, substitute rules, programming requirements, and test instructions.

Conclusion

Reliable PCB component selection connects circuit performance to manufacturability, verification, and supply continuity. Define requirements first, derive support networks from current manufacturer documents, verify ratings and footprints, plan for production and lifecycle risk, and control every substitute through documented change review. EBest Circuit can support the transition from design files and BOM review to PCB fabrication and PCBA preparation without replacing the customer’s component-design authority. If you are sourcing PCB/PCBA manufacturing, send your Gerber/ODB++, BOM, quantity, stackup, assembly, programming, and test requirements to sales@bestpcbs.com for engineering review and a quotation.

You may also like

What Are Standard Capacitor Values? E-Series Charts and PCB Selection

August 6th, 2026

standard capacitor values are preferred nominal capacitances selected from repeating E-series numbers. Instead of manufacturing every possible value, suppliers offer practical steps such as 10, 15, 22, 33, 47, and 68, then scale those numbers by powers of ten. That system makes components easier to specify, source, substitute, and control in a BOM.

The printed capacitance is only the starting point. A value that is mathematically correct can still be unsuitable because of voltage rating, dielectric behavior, ESR, package size, temperature, or availability. The useful workflow is therefore: identify the target, choose the appropriate E-series value, confirm the real component, and verify it under circuit conditions.

PCB and organized trays of ceramic, film, and electrolytic capacitors on an engineering bench

What Are Standard Capacitor Values?

A standard capacitor value is a preferred nominal capacitance that manufacturers commonly offer. The values are organized into E-series defined for resistors and capacitors by IEC 60063. Each series divides one decade into a fixed number of approximately logarithmic steps. The same base sequence then repeats at 10 times and one-tenth of the value.

For example, 4.7, 47, and 470 belong to the same preferred-number family. With the appropriate unit, that pattern can describe 4.7 pF, 47 nF, or 470 µF. “Standard” does not mean that every manufacturer stocks every combination of capacitance, dielectric, voltage, tolerance, and package. It means the nominal number follows a preferred sequence.

Nominal capacitance is also not the same as measured or effective capacitance. A 10 µF part may legally measure within its tolerance at specified test conditions and may deliver less capacitance when DC voltage, temperature, or aging affects the dielectric.

Why Do Capacitors Follow E-Series Preferred Values?

E-series values provide useful coverage without requiring an unlimited inventory. The steps are approximately logarithmic, so the percentage gap between neighboring values stays reasonably consistent throughout a decade. A wider-tolerance series needs fewer steps; a tighter series can use more steps to offer finer choices.

The conventional relationship is E6 for about 20% steps, E12 for about 10%, and E24 for about 5%. This relationship explains the historical spacing, but it is not a promise about a modern component’s tolerance. A manufacturer may sell an E12 nominal value with a tighter tolerance, or may omit a preferred value for a particular product family.

Standardization helps an engineer avoid unnecessary custom values. It also makes second sourcing more realistic: a 22 nF or 4.7 µF requirement is easier to search, qualify, and substitute than an arbitrary value that only one vendor lists.

What Values Are Included in the E6, E12, and E24 Charts?

The E6, E12, and E24 charts contain 6, 12, and 24 normalized values per decade. The table below shows the values from 10 to below 100; multiply or divide by powers of ten to move to another decade.

Series Values per decade Normalized preferred values Conventional spacing context
E6 6 10, 15, 22, 33, 47, 68 About 20%
E12 12 10, 12, 15, 18, 22, 27, 33, 39, 47, 56, 68, 82 About 10%
E24 24 10, 11, 12, 13, 15, 16, 18, 20, 22, 24, 27, 30, 33, 36, 39, 43, 47, 51, 56, 62, 68, 75, 82, 91 About 5%

Thus, the E6 base value 47 can become 47 pF, 470 pF, 4.7 nF, 47 nF, 470 nF, 4.7 µF, or 47 µF. This decade-scaling rule is the practical bridge between the chart and a schematic value.

Selection diagram connecting E6, E12, and E24 value density with capacitor choice and PCB verification

How Do You Read Capacitor Values Across pF, nF, and uF?

Capacitance units change by factors of 1,000. The core relationships are 1 µF = 1,000 nF and 1 nF = 1,000 pF. Therefore, 1 µF = 1,000,000 pF. The ASCII form “uF” is often used when a CAD tool or database cannot preserve the µ character.

µF nF pF Same capacitance
1 1,000 1,000,000 1 µF = 1,000 nF = 1,000,000 pF
0.47 470 470,000 0.47 µF = 470 nF
0.1 100 100,000 0.1 µF = 100 nF
0.047 47 47,000 0.047 µF = 47 nF
0.001 1 1,000 0.001 µF = 1 nF

Use the unit that produces the clearest number. Writing 100 nF is usually easier to scan than 0.1 µF, although both are correct. Consistent units in the schematic, BOM, AVL, and assembly drawing reduce factor-of-1,000 errors. For more notation examples, see the microfarad symbol and conversion guide.

How Do You Find the Nearest Standard Capacitor Value?

Find the nearest value by normalizing the target, comparing its two neighboring E-series values, and checking the permitted error direction. Use the following sequence:

  1. Normalize the target: Write the target in one unit, such as 36 nF.
  2. Select the series: Choose the candidate series, such as E12.
  3. Locate the neighbors: Compare 36 with the neighboring E12 values, 33 and 39.
  4. Calculate the error: Find the signed difference from the target.
  5. Check the allowed direction: Determine whether the circuit permits rounding upward, downward, or only within a defined range.
  6. Confirm the real part: Verify availability with the required voltage, dielectric, tolerance, and package.

For 36 nF, 33 nF is 3 nF low and 39 nF is 3 nF high. The numerical tie does not decide the circuit result. In a timing, filter, compensation, or resonant network, evaluate which direction keeps the complete transfer function inside its limit. For decoupling or bulk storage, a higher nominal value may appear attractive, but stability, inrush, ESR, size, and effective capacitance still matter.

How Should You Choose Between E6, E12, and E24 Values?

Choose the coarsest series that satisfies the circuit, then verify real part availability. E6 is useful when the circuit tolerates broad steps and part simplification is valuable. E12 gives a practical middle ground for many general-purpose designs. E24 provides finer adjustment for analog thresholds, filters, timing, or tuning, but only when component tolerance and operating drift do not overwhelm the smaller step.

Decision factor E6 E12 E24
Value resolution Coarse Moderate Fine
Typical use Broad-tolerance functions and inventory reduction General-purpose value selection Closer targeting and adjustment
Main risk Large gap from calculated target May still miss a narrow window False precision if tolerance and drift dominate
Required check Manufacturer availability and worst-case circuit analysis

Do not select E24 merely because it offers more numbers. A nominal 36 nF value with ±10% tolerance does not necessarily control a circuit more tightly than a carefully analyzed 33 nF value with a better dielectric and tolerance.

How Do Available Standard Values Differ Among Ceramic, Film, and Electrolytic Capacitors?

The preferred-number system is shared, but stocked values and operating limits differ by capacitor technology. Ceramic capacitors cover very small capacitances through multi-microfarad values and are common in compact surface-mount packages. Film capacitors are attractive for stability, low loss, pulse handling, or selected high-voltage applications, but often occupy more board area. Aluminum electrolytics commonly cover larger capacitance ranges and power filtering, with polarity, ESR, ripple current, and lifetime constraints.

Technology Selection strength Important limitation PCB/BOM check
Ceramic/MLCC Small package, low inductance, broad availability DC bias, temperature characteristic, aging Effective capacitance at operating voltage
Film Stability, low loss, pulse capability Larger size and a less dense catalogue in some ranges Lead spacing, body clearance, pulse/voltage data
Aluminum electrolytic High capacitance and bulk energy storage Polarity, ESR, ripple, temperature, lifetime Diameter, height, polarity marking, endurance rating

A standard 10 µF value therefore does not identify an interchangeable component. A 10 µF MLCC, film capacitor, and electrolytic can have very different voltage behavior, impedance, footprint, polarity, and cost.

When Should You Combine Capacitors to Create a Non-Standard Value?

Combine capacitors only when no single qualified part meets the target or the network provides another verified benefit. In parallel, capacitances add: Ctotal = C1 + C2 + …. A 33 nF and 3.3 nF capacitor in parallel produce a nominal 36.3 nF.

For two capacitors in series, Ctotal = (C1 × C2) / (C1 + C2). Two equal capacitors in series produce half the capacitance. Voltage does not always divide equally, especially when leakage differs, so series stacks require voltage-sharing analysis and may need balancing components.

A network adds placements, pads, assembly opportunities, tolerance contributors, and procurement lines. Prefer one qualified part when it meets the requirement. Use combinations when analysis shows the circuit benefit justifies the extra PCB area and manufacturing complexity.

Why Can an MLCC’s Effective Capacitance Be Lower Than Its Nominal Value?

Class II MLCCs can deliver less effective capacitance as applied DC voltage increases. Package size, dielectric formulation, rated voltage, nominal capacitance, temperature, and aging all influence the result. Two parts with the same 10 µF label can therefore deliver different effective capacitance on the same rail.

Do not estimate DC-bias loss from the nominal value alone. Use the manufacturer’s capacitance-versus-DC-bias curve at the intended voltage and consider tolerance, temperature characteristic, and aging in the worst-case budget. The nominal marking remains 10 µF; the capacitance available to the circuit may be substantially lower.

This distinction is particularly important for regulator stability, hold-up time, filtering, and sensitive analog networks. The SMD capacitor selection guide provides additional context on package, polarity, and technology choices.

How Do Voltage Rating, ESR, and Package Size Affect PCB Capacitor Selection?

Capacitance alone cannot qualify a PCB capacitor. Voltage rating establishes a limit, not a universal operating recommendation. Apply the derating required by the capacitor technology, environment, applicable standard, and manufacturer. For MLCCs, a higher voltage rating or larger package may also improve effective capacitance, but the actual bias curve must confirm it.

ESR changes heat generation, ripple behavior, damping, and power-supply stability. A replacement with the same capacitance but much lower or higher ESR can alter circuit behavior. Use impedance and ESR data at the relevant frequency and temperature rather than relying on a single headline value.

Package size affects land pattern, assembly clearance, voltage capability, mechanical stress, and parasitic inductance. A smaller MLCC may have lower loop inductance but can lose more capacitance under bias and may be more sensitive to board flex. Placement also matters: decoupling capacitors need a short current loop, appropriate plane/via connections, and a verified return path. Review the manufacturer footprint and the capacitor PCB design considerations before releasing the layout.

How Should Capacitor Values Be Verified in the BOM and Prototype?

Verification must connect the calculated value to an exact manufacturer part number and measured prototype behavior. A generic “10 µF, 16 V, 0805” description is not enough when dielectric, tolerance, thickness, and DC-bias performance determine the result.

  1. Define the acceptance window: Record the design target and permitted capacitance range.
  2. Lock the exact specification: State the manufacturer part number, technology, tolerance, rated voltage, case size, and temperature range.
  3. Calculate the worst case: Determine effective capacitance at the actual voltage and temperature.
  4. Qualify alternates: Compare substitutes against the same functional limits instead of nominal capacitance alone.
  5. Check PCB fit: Verify footprint, height, polarity, courtyard, placement, and assembly access.
  6. Measure the prototype: Document frequency, test voltage, bias, temperature, and fixture conditions.
  7. Release the evidence: Complete the relevant functional and environmental tests, then record the approved BOM revision.
PCB prototype in a fixture connected to laboratory probes for capacitor verification

Do not compare an in-circuit reading directly with a catalogue tolerance unless the measurement method isolates the component and matches the specified test conditions. Parallel circuit paths, fixture capacitance, meter frequency, and residual charge can distort the result.

FAQs About Standard Capacitor values

Q1: What are standard capacitor values?

A1: They are preferred nominal capacitances. Common sequences include E6, E12, and E24, scaled across pF, nF, and µF decades.

Q2: What are standard values for ceramic disc capacitors?

A2: Ceramic discs commonly use preferred E-series values. The available range depends on dielectric, voltage, tolerance, lead spacing, and manufacturer, so check the exact product series.

Q3: Is there a standard capacitor values table?

A3: Yes, E6, E12, and E24 tables provide the reference. They list 6, 12, and 24 preferred numbers per decade, which scale by powers of ten.

Q4: Are E12 capacitor values always 10% tolerance?

A4: No, E12 does not guarantee 10% tolerance. The spacing has that historical association, but a modern part can specify a different tolerance.

Q5: What is the smallest standard capacitor value?

A5: There is no universal smallest standard value. Preferred numbers repeat into lower decades, while practical minimums depend on construction, package, parasitics, and manufacturer range.

Q6: Are standard SMD capacitor values different from through-hole values?

A6: The preferred numbers can be the same. Available capacitance, voltage, dielectric, and tolerance combinations differ by package and technology; SMD is not a separate E-series.

Q7: How do I convert standard capacitor values from nF to µF?

A7: Divide the nF value by 1,000. For example, 100 nF equals 0.1 µF, while 47 nF equals 0.047 µF.

Q8: Can I replace a capacitor with the nearest standard value?

A8: Only when the circuit tolerates the substitution. Check the direction of error because timing, filter, compensation, resonant, and regulator circuits can be sensitive.

Q9: Can I use a higher voltage capacitor with the same capacitance?

A9: Often, but not automatically. Confirm package size, dielectric, ESR, ripple, polarity, effective capacitance, safety class, and circuit behavior.

Q10: Why is a measured capacitor value different from its nominal value?

A10: Measurement conditions and operating stress can change the result. Check tolerance, frequency, test voltage, DC bias, temperature, aging, fixture capacitance, and parallel circuit paths.

Conclusion

standard capacitor values turn an unlimited numerical range into practical E6, E12, and E24 choices. Start with the correct chart and unit, calculate the nearest acceptable value, and then verify technology, voltage, ESR, package, effective capacitance, and availability. The final decision is not complete until the exact part and its approved alternates pass BOM, layout, and prototype checks.

For PCB design review, component sourcing, prototype assembly, or production support, email sales@bestpcbs.com with your schematic, BOM, PCB files, operating voltage, and capacitor selection requirements.

You may also like

Galvanic Skin Sensor: EDA Circuit and PCB Design Guide

August 4th, 2026

A galvanic skin sensor, often called a GSR sensor, measures electrodermal activity (EDA): changes in skin conductance produced through a two-electrode measurement path. It can track changes associated with sympathetic arousal, but it cannot identify a specific emotion by itself. Reliable data requires controlled electrode contact, adequate analog-front-end range, low PCB leakage, artifact detection and a repeatable validation method.

Galvanic skin sensor PCB with two wearable skin-contact electrodes on a laboratory bench

What Electrical Quantity Does a Galvanic Skin Sensor Measure?

Electrically, the sensor converts the skin-electrode resistance into conductance, the reciprocal quantity used for EDA measurement. The two electrodes, controlled excitation, analog front end and ADC form one measurement chain; sweat-gland activity changes the conductive path through the outer skin.

The conversion is:

G = 1 / R

where G is conductance in siemens and R is resistance in ohms. EDA is commonly reported in microsiemens (µS). If the circuit uses a known voltage, current can be converted to conductance. If it uses a known current, the measured voltage provides resistance and then conductance. In both cases, the electrodes and skin form a time-varying electrochemical interface rather than an ideal resistor.

EDA is most useful when conductance changes can be synchronized with a defined event or another measured channel. Typical uses include psychophysiology research, workload studies, usability testing and wearable sensing; EDA is an arousal-related input, not a stand-alone emotion label or diagnosis.

How Does a Galvanic Skin Sensor Measure Electrodermal Activity?

The sensor applies a controlled excitation, measures the skin-electrode response and converts that response into a conductance time series. Most EDA systems use an exosomatic method: the instrument supplies a small constant voltage or constant current instead of relying only on naturally occurring skin potential.

Signal-Chain Stage Engineering Task Primary Failure Risk
Electrodes Create repeatable skin contact Pressure change, drying gel, motion or polarization
Excitation Set a known voltage or current Excessive stimulus, drift or loss of linear range
Analog front end Convert and condition a high-impedance signal Input bias, leakage, saturation and power noise
Low-pass filter Limit out-of-band noise and aliasing Removing real phasic content or retaining motion artifacts
ADC and firmware Digitize, timestamp and quality-check samples Insufficient range, resolution, synchronization or metadata

A constant-voltage design can measure current with a transimpedance stage or infer conductance from a divider. A constant-current design measures the voltage developed across the skin path. The chosen topology must keep the full expected impedance range inside the AFE and ADC limits. The Analog Devices AD5940 EDA example uses a resistor-capacitor test board to model skin, body, electrode and contact impedance and identifies a typical model range of approximately 20 kΩ to 10 MΩ. That range is a useful design stimulus for a bench fixture, not a universal human acceptance limit.

Which Electrodes and Body Locations Produce Usable EDA Data?

Electrode material, area, spacing, pressure and body location must be controlled together because each changes the skin-electrode interface. Laboratory systems often use Ag/AgCl gel electrodes on the palm or fingers, where eccrine sweat-gland density is high. Wearables commonly use dry metal electrodes on the ventral wrist because that position is practical, although it can be less sensitive and more dependent on strap pressure.

  • Ag/AgCl gel electrodes: Often provide stable, low-noise laboratory contact, but gel can dry and shelf life must be managed.
  • Dry metal electrodes: Support reusable wearables, but contact impedance changes more with motion, pressure, skin hair and fit.
  • Electrode area: Affects current density and interface impedance; changing area between prototypes invalidates direct comparisons.
  • Placement: Palms and fingers can provide strong responses but constrain activity; wrist placement improves wearability and increases artifact-control demands.
  • Preparation: A protocol should define cleaning, settling time, strap force or adhesive method and replacement interval.
Galvanic skin sensor wristband with two metal electrodes and a compact sensor PCB

How Should Engineers Design the Analog Front End?

The analog front end must cover the expected skin and contact impedance without allowing bias current, PCB leakage, offset or interference to dominate the measurement. Start with the measurement range and excitation limit, then calculate the output at both conductance extremes. Select the topology, gain and reference voltage only after confirming headroom across supply, tolerance and temperature.

For constant-voltage excitation, calculate Imax = Vexc / Rmin and Imin = Vexc / Rmax, then size the sense element and gain so both currents remain measurable. For constant-current excitation, verify that Vmax = Iexc × Rmax stays within the compliance voltage and ADC range.

  • Input bias and leakage: Choose amplifiers, switches and protection parts whose leakage remains small relative to the minimum measured current across temperature.
  • Output headroom: Check dry-contact, open-electrode and highly conductive conditions so the amplifier and ADC do not silently clip.
  • Reference stability: Excitation and ADC reference noise can appear as conductance change; use ratiometric measurement where the topology permits.
  • Protection capacitance: ESD devices protect the user interface but add leakage and capacitance. Qualify the exact part in the intended range rather than copying a generic protection circuit.
  • Range switching: If multiple feedback resistors are used, include switch leakage, charge injection and settling time in the error budget.

A published low-resource wearable design used an AFE followed by a fourth-order low-pass filter and designed its signal path for 0–1 Hz. That implementation is evidence that EDA is a slow signal; it is not a requirement that every product use the same filter order or cutoff. Define the passband from the intended tonic and phasic features, then verify the response with injected waveforms.

Which Sampling, Filtering and ADC Choices Preserve the EDA Signal?

Derive the sampling rate from the required passband, analog anti-alias filter and synchronization requirement. The Nyquist rate is only the mathematical lower bound: sample above twice the highest passed frequency with enough margin for the real filter transition, then verify that the ADC range preserves both dry-contact and high-conductance conditions without clipping.

Use the following decision chain to turn the required EDA features into measurable filter, ADC and data-quality requirements:

  1. Define the signal band: Specify the slow tonic trend and fastest phasic feature that the study or product must preserve; this becomes the input requirement for filtering and sampling.
  2. Set the analog cutoff: Choose the anti-alias filter from the highest wanted frequency and its real transition band, then verify attenuation before frequencies can fold into the EDA band.
  3. Calculate the sampling rate: Start above twice the highest passed frequency, add margin for the non-ideal filter transition and confirm that timing supports event alignment.
  4. Size the ADC range: Convert the dry-contact and high-conductance endpoints into expected AFE voltages so neither endpoint clips or disappears below the usable code range.
  5. Verify effective resolution: Include reference noise, amplifier noise, quantization, gain tolerance and digital filtering; nominal ADC bits alone do not prove that the smallest required conductance change is measurable.
  6. Preserve diagnostic evidence: Synchronize EDA with motion, temperature and event markers, and retain raw or minimally processed samples plus range and saturation status for artifact review.

Averaging can reduce random noise but can also smear a short phasic conductance response or hide a step caused by electrode motion. Document cutoff, order, phase behavior, edge handling and every removed segment so reviewers can reproduce the processing. A smooth plot is not proof of valid source data; compare filtered output with raw samples and synchronized artifact channels.

What Causes False Peaks, Drift and Saturation in Galvanic Skin Data?

False EDA events most often come from the electrode interface, motion, environment, range limits or power interference rather than the autonomic response being studied. A systematic review of EDA collection identifies motion, temperature variation and electrical noise as important confounders. Ambulatory measurement adds variable strap pressure, skin hydration and changing environmental conditions.

Observed Pattern Possible Cause Next Check
Near-zero or flat signal Open electrode, dry contact or broken lead Measure contact continuity and test with a known resistor
Sudden step during movement Pressure change or electrode slip Compare accelerometer and strap/contact data
Slow baseline drift Temperature, hydration, electrode polarization or leakage Repeat with controlled environment and simulated impedance
Clipped high reading AFE or ADC saturation, excessive sweating or conductive bridge Inspect raw code, range state and electrode spacing
Periodic ripple Power-line, switching regulator or digital coupling Measure the spectrum and probe supplies/returns

Compare each event with a protocol-specific baseline and synchronized artifact channels rather than applying one universal threshold. Any model that labels stress, emotion or pain must define its population, inputs, exclusions and validation method.

How Should a Galvanic Skin Sensor PCB Be Laid Out?

Protect high-impedance electrode and feedback nodes from leakage, return-current coupling, switching edges and contaminated surfaces. The exact stack-up and layout depend on topology, but the PCB review should trace every sensitive node from connector to AFE and every return path back to its source.

  • Short sensitive paths: Place the AFE close to the electrode connector and keep high-impedance traces away from clocks, antennas, DC/DC switch nodes and high-current LED or motor paths.
  • Defined returns: A four-layer board can simplify continuous reference planes, but layer count does not correct a broken return path. Separate noisy load currents by placement and routing, then connect analog and digital domains according to the converter and AFE reference architecture.
  • Guarding: A driven or quiet guard can reduce surface leakage around a very high-impedance node, but only if its voltage, stability, clearance and test access are engineered for the circuit.
  • Power filtering: Isolate AFE supply noise with a suitable regulator, local decoupling and controlled current loops. Verify startup and radio-transmit disturbances.
  • Connector protection: Put ESD and current-limiting elements at the entry point while qualifying their leakage across temperature and humidity.
  • Testability: Add accessible points for excitation, reference, AFE output, ground and digital timing without turning the sensitive node into a large contamination antenna.

Which PCBA Materials and Assembly Controls Protect High-Impedance Nodes?

Flux residue, moisture, fingerprints and unsuitable protective materials can create leakage paths comparable to the signal being measured. High-impedance performance must therefore be specified as an assembled-board requirement, not inferred from the bare PCB alone.

  • Cleaning process: Define flux type, cleaning chemistry, rinse, drying and ionic-contamination acceptance appropriate to the assembly.
  • Solder mask and spacing: Review mask dams, exposed copper, connector pads and creepage paths around the electrode input. Do not assume solder mask is a perfect insulator.
  • Conformal coating: Select coating for the intended humidity and biocompatibility boundary, while keeping connectors, electrodes and test contacts properly masked.
  • Protection components: Control approved manufacturer part numbers because substitution can change leakage and capacitance even when package and voltage rating match.
  • Handling: Use gloves and controlled packaging for cleaned high-impedance assemblies; visual cleanliness does not prove electrical cleanliness.
  • Environmental verification: Repeat leakage and zero-input tests at relevant temperature and humidity rather than qualifying only at room conditions.

Manufacturing documentation should identify sensitive nets, no-touch areas, cleaning requirements, coating keep-outs and functional-test limits. Release the assembly drawing, coating drawing and test specification under revision control so the supplier can trace each requirement to the approved build.

How Can Engineers Validate a Galvanic Skin Sensor Without a Human Subject?

Use a traceable resistor-capacitor network or impedance simulator to validate range, linearity, bandwidth and fault response before any human-subject work. This separates electronic performance from biological variability and allows repeatable regression testing.

  1. Zero and open input: Confirm the reported state, recovery behavior and absence of unsafe or undefined output.
  2. Resistance sweep: Apply known values spanning the intended range, including endpoints and range-switch boundaries.
  3. Dynamic step: Switch between known impedances and measure settling, overshoot and digital filter delay.
  4. Parallel capacitance: Add representative capacitance to model electrode and cable effects, then verify stability.
  5. Interference injection: Operate radios, displays, chargers and switching supplies while monitoring error and spectrum.
  6. Leakage stress: Repeat at temperature and humidity corners and after the specified assembly cleaning process.
  7. Fault tests: Exercise lead-off, shorted electrodes, reversed accessories, ESD protection behavior and ADC clipping.
  8. Golden-unit regression: Store raw results, fixture identification, firmware version and pass/fail limits for future builds.
Galvanic skin sensor PCB connected to probes and a resistor-capacitor validation fixture

Which Safety and Compliance Boundaries Apply to Skin-Contact Devices?

The applicable safety path follows intended use, claims, contact duration, power architecture and market classification; a research sensor and a medical device do not share the same release evidence. Begin by documenting whether the device only supports research or wellness observation, or whether it makes a diagnostic, monitoring or treatment claim.

For skin-contact materials, evaluate the finished electrode, gel, adhesive and exposed housing as one contact system under the intended contact type and duration. If the product enters a medical-device pathway, the biological evaluation plan may need to consider ISO 10993-1; a component data sheet alone is not finished-product evidence.

If the finished product is medical electrical equipment, IEC 60601-1 addresses general basic safety and essential performance, and collateral or particular standards may also apply. A bare-board functional pass is not system-level safety evidence. Battery charging while worn, USB connection, isolation, leakage current and accessory use require system-level review.

What Should Engineers and Buyers Include in an RFQ?

An RFQ should define the electrical range, electrode interface, PCB/PCBA build, firmware state and validation evidence instead of requesting only a board quantity. Incomplete inputs can produce a board that powers on but cannot meet leakage, noise or safety requirements.

  • Design files: Gerber or ODB++, drill data, stack-up, schematic, BOM, centroid data and assembly drawings.
  • Sensor interface: Electrode material, connector, cable, expected impedance range, excitation and contact configuration.
  • Signal requirements: Bandwidth, sample rate, ADC range, resolution target, allowable drift, noise and settling time.
  • PCB controls: Controlled sensitive nets, grounding approach, surface finish, cleanliness, coating and keep-out requirements.
  • Programming: Firmware image, programming interface, configuration data, calibration constants and serialization needs.
  • Functional test: Fixture circuit, resistance/capacitance points, pass limits, raw-data format and golden-unit procedure.
  • Compliance context: Intended use, skin-contact duration, target markets and applicable safety or regulatory plan.

Require the supplier to return DFM findings, component-risk questions, test coverage and fixture responsibilities, together with every requirement that still needs engineering confirmation before the quotation is treated as final.

FAQs About Galvanic Skin Sensors

Q1: Should electrode contact quality be reported separately from EDA?
A1: Yes—contact quality should have its own status or confidence indicator. A lead-off flag, impedance check or stability score prevents downstream software from treating a detached or unstable electrode as physiological data.

Q2: Should the cable between the electrodes and PCB be shielded?
A2: Use shielding only after evaluating added capacitance, leakage and return-current effects. Compare noise and settling with the intended cable length, motion and connector rather than assuming that a shield always improves the signal.

Q3: How should calibration constants be stored?
A3: Version calibration constants by unit, hardware revision and firmware build. Protect them with a checksum or equivalent integrity check and retain the fixture ID and calibration date.

Q4: Which connector properties matter at the electrode input?
A4: Prioritize low leakage, cleanability, stable contact resistance and strain relief. Also verify touch safety, mating-cycle life and whether flux or coating can become trapped around the sensitive pins.

Q5: Can one analog front end multiplex several electrode pairs?
A5: Yes, but switch leakage, charge injection, crosstalk and settling become part of the error budget. Validate every channel and switching sequence across temperature and the full impedance range.

Q6: How should startup and electrode settling be handled?
A6: Define a settling interval and suppress interpretation until contact and AFE output meet stable criteria. Record any range changes or lead-off events that restart the interval.

Q7: Which telemetry helps diagnose field failures?
A7: Store raw ADC code, active range, saturation, lead-off status and timestamps. Motion, temperature, battery and charging state make intermittent contact and interference much easier to reproduce.

Q8: When does a new electrode accessory require revalidation?
A8: Revalidate after changes to material, area, spacing, gel, adhesive, cable or connector. These changes can alter impedance, polarization, motion sensitivity and the applicable skin-contact assessment.

Q9: How should engineers isolate a failed sensor board?
A9: Inject a known impedance and trace the result stage by stage. Compare excitation, AFE output, ADC code and firmware conversion against a passing unit to identify whether the fault is analog, conversion-related or computational.

Q10: How often should the production fixture be calibrated?
A10: Set the interval from component tolerance, drift history, usage and product risk. Include an out-of-tolerance response that identifies affected units and triggers containment or retest.

If you need PCB manufacturing or PCBA support, contact EBest Circuit at sales@bestpcbs.com and submit Gerber/ODB++, BOM, quantity, stack-up, assembly, programming and functional-test requirements so the engineering team can review manufacturability and test scope before quotation.

You may also like

Absolute Pressure Sensors: Principles, PCB Design, and Testing

August 4th, 2026

Absolute pressure sensors measure pressure from a fixed vacuum reference instead of comparing it with the changing atmosphere. That distinction makes them suitable for barometric measurement, altitude estimation, sealed systems, vacuum processes, and other applications where local weather or elevation must not redefine zero. A successful design depends on more than the sensing range. The reference type, pressure port, transfer function, temperature behavior, package stress, PCB layout, assembly process, and calibration method must all agree with the measurement task.

Absolute pressure sensors mounted on a printed circuit board in a laboratory

What Is an Absolute Pressure Sensor?

An absolute pressure sensor reports pressure relative to absolute zero pressure. Its zero reference is a sealed vacuum, not the air around the device. Pressure applied to the sensing side acts against that internal reference, allowing the output to represent the total pressure of the medium rather than the amount above or below the current atmosphere.

This reference point separates absolute sensing from gauge sensing. A gauge device uses local atmospheric pressure as its reference, so its zero follows weather and elevation. A differential device compares two accessible pressure ports. An absolute device normally has one process-pressure path and an internal sealed reference that the system cannot vent or reconnect.

The pressure value must include a clear reference notation. Common forms include kPa absolute, bar absolute, and psia. A bare value such as 100 kPa is incomplete when the context does not make the reference obvious. At normal atmospheric conditions, an absolute sensor may report close to atmospheric pressure while a vented gauge sensor reports close to zero. Both readings can be correct because they answer different questions.

How Do Absolute Pressure Sensors Work?

Pressure bends a diaphragm, and the sensor converts that deformation into an electrical result. A practical absolute sensor seals a high-vacuum cavity behind its sensing diaphragm. The process medium acts on the opposite side. The resulting mechanical strain changes resistance, capacitance, resonant frequency, or another measurable electrical property.

In a piezoresistive MEMS device, resistive elements placed in stressed regions of a silicon diaphragm form part of a bridge. Pressure changes the diaphragm strain and unbalances the bridge. An amplifier and compensation circuit then convert the small bridge signal into an analog voltage, current, or digital pressure code. Capacitive devices instead detect a change in spacing between the flexible diaphragm and a fixed electrode.

The conversion path usually contains several stages:

  • Pressure input: The medium reaches the sensing diaphragm through a port, opening, or protective interface.
  • Mechanical response: The diaphragm deflects according to the pressure difference between the process side and the sealed reference.
  • Electrical conversion: A resistive, capacitive, or resonant element converts deflection into a raw signal.
  • Signal conditioning: An ASIC amplifies, linearizes, and compensates the raw response for temperature and device variation.
  • System output: The result appears as an analog voltage, a current signal, or a digital value over an interface such as I2C or SPI.

The sealed reference is stable, but the complete sensor is not automatically error-free. Diaphragm nonlinearity, bridge offset, package stress, temperature gradients, media compatibility, supply noise, and long-term drift can all move the reported value. Datasheet accuracy therefore needs to be read together with the conditions and error terms used to define it.

Absolute vs Gauge Pressure Sensors: What Is the Difference?

The difference is the reference pressure, not simply the package shape or output interface. Absolute pressure is referenced to vacuum. Gauge pressure is referenced to local atmosphere. Differential pressure is the difference between two applied pressures. Selecting the wrong reference can create a large systematic error even when the sensor is functioning normally.

The relationship between absolute and gauge pressure is:

Pabs = Pgauge + Patm

Here, Pabs is absolute pressure, Pgauge is pressure relative to the local atmosphere, and Patm is local atmospheric pressure. The equation is simple, but Patm is not constant. It changes with elevation and weather. A fixed conversion using a nominal atmospheric value is therefore unsuitable when the required uncertainty is smaller than those changes.

Pressure Type Reference Typical Ports Best Fit Main Risk
Absolute Sealed vacuum One process input Barometry, altitude, sealed vessels, vacuum processes Using gauge limits or calibration assumptions
Gauge Local atmosphere One process input plus an atmospheric vent Tires, open tanks, pumps, pneumatic lines Blocked or contaminated vent path
Differential Second applied pressure Two pressure inputs Filter drop, flow elements, room pressure Overpressure on one side or reversed connections

Absolute sensing is the correct choice when the value must remain tied to a fixed zero reference. Gauge sensing is often better when only pressure above the surrounding atmosphere matters. Differential sensing is required when the decision depends directly on the difference between two process points. Two separate absolute sensors can be subtracted in software, but their independent offset, temperature error, drift, and timing differences combine. That arrangement is not automatically equivalent to a differential sensor.

Which Technologies Do Absolute Pressure Sensors Use?

Piezoresistive and capacitive MEMS devices cover many embedded and industrial applications, but the best technology depends on range, stability, media, and bandwidth. The transduction method affects sensitivity, power, package construction, signal conditioning, temperature behavior, and suitability for static or dynamic measurements.

  • Piezoresistive MEMS: Diaphragm strain changes implanted or deposited resistors. These devices can provide high sensitivity and compact integration, but bridge offset and temperature coefficients require compensation.
  • Capacitive MEMS: Diaphragm movement changes capacitance. Low power and strong sensitivity are possible, although parasitic capacitance, contamination, and package stress require careful control.
  • Resonant sensing: Pressure changes the frequency of a resonant structure. Frequency outputs can support excellent stability and resolution, but the construction and electronics are more complex.
  • Strain-gauge metal diaphragms: Bonded or thin-film strain elements measure deformation of a metal structure. This approach is common where rugged packaging and media isolation are important.
  • Specialized vacuum gauges: Pirani, ionization, and other vacuum technologies serve ranges where a conventional diaphragm sensor is no longer the best measurement method.

Piezoelectric sensing deserves a separate warning. It responds well to changing pressure and fast transients, but charge leakage makes many piezoelectric devices unsuitable for accurate static pressure measurement. A technology that performs well during a pressure pulse may not hold a stable DC reading.

Which Range, Accuracy, Resolution, and Response Time Matter?

Start with the real pressure envelope and required uncertainty, then check every datasheet term under the intended conditions. A wide range protects against overload but usually gives fewer output counts per unit of pressure. A narrow range improves usable sensitivity but may leave inadequate margin for startup surges, altitude changes, proof pressure, or fault conditions.

Important specifications include:

  • Operating range: The interval over which the sensor is intended to report pressure. Confirm that the units and reference are absolute.
  • Proof pressure: A temporary pressure that should not cause a permanent specification shift. It is not a normal operating target.
  • Burst pressure: A structural limit associated with physical failure. It must never be treated as a usable measurement range.
  • Total error: Determine whether the stated accuracy includes offset, span, nonlinearity, hysteresis, temperature, and long-term drift or only a subset.
  • Resolution: The smallest output step does not guarantee equal measurement accuracy. Noise and systematic error can be much larger than one code.
  • Response time: Port volume, tubing, digital filtering, output data rate, and sensor bandwidth can all limit the response.
  • Media compatibility: Gas, liquid, condensation, corrosive vapor, and particulates can require a different port, gel, diaphragm material, or isolation method.

Ratiometric analog sensors also tie their output scale to supply voltage. If the analog-to-digital converter uses the same supply as its reference, supply movement can cancel in the ratio. If it uses a different reference, supply tolerance becomes a measurement error unless the design measures or regulates that supply.

How Should Analog and Digital Absolute Pressure Sensor Outputs Be Read?

The electrical interface must preserve the sensor transfer function without adding supply, timing, or conversion error. Analog outputs require a valid ADC range, reference strategy, source impedance, filtering, and fault limits. Digital outputs require correct logic levels, bus timing, pull-up values, command sequencing, status handling, and pressure-code conversion.

For a linear analog sensor, pressure can often be calculated from a datasheet transfer function of the form:

P = (Vout – Voffset) / Sensitivity

Voffset and Sensitivity must come from the selected part and operating conditions. Some sensors specify normalized output as a fraction of supply rather than fixed volts. Firmware must also reject readings outside the valid electrical range and distinguish a real pressure extreme from an open circuit, short circuit, startup state, or saturated ADC.

Digital sensors commonly return a raw pressure code plus temperature and status information. The conversion may use calibration coefficients stored inside the device. Read the complete transaction defined in the datasheet. Mixing byte order, signed and unsigned arithmetic, pressure units, or compensation timing can produce a plausible but wrong result. A repeated I2C address also matters when several identical sensors share one bus.

The analog input vs digital input choice affects fault detection, wiring, conversion, and test coverage. Digital output reduces sensitivity to analog routing noise after conversion, but it does not remove pressure-port, thermal, package-stress, calibration, or media errors.

How Should Absolute Pressure Sensors Be Integrated on a PCB?

Place the sensor where pressure can reach the port cleanly while heat, board strain, contamination, and electrical noise remain controlled. The package is both a mechanical measuring element and an electronic component. A layout that is electrically correct can still shift readings if the PCB bends the package or conducts heat from a regulator into the sensor.

Absolute pressure sensor PCB layout with nearby interface and decoupling components
  • Pressure access: Keep the port opening clear. Align enclosure holes, gaskets, manifolds, and tubing without side loading the package.
  • Thermal isolation: Separate the sensor from regulators, processors, power resistors, and airflow that creates rapid local temperature changes. Board slots may help when the selected manufacturer recommends them.
  • Mechanical isolation: Avoid mounting holes, snap fits, connectors, and depaneling tabs that bend the PCB near the package.
  • Local decoupling: Place the specified bypass capacitor close to the supply pins with a short return path.
  • Interface routing: Keep analog traces away from switching nodes. Size I2C pull-ups for bus capacitance, voltage, and timing instead of copying a default value.
  • Contamination control: Prevent flux, cleaning liquid, conformal coating, adhesive, dust, and condensation from entering the port.
  • Test access: Provide accessible supply, ground, bus, interrupt, and analog nodes so electrical faults can be separated from pressure faults.

Package land patterns, solder-paste apertures, reflow limits, and handling rules must follow the exact component documentation. Pressure packages may include open cavities, gels, membranes, or delicate ports. Vacuum pickup position and cleaning methods that are harmless for a sealed IC can damage or contaminate a sensor.
Which PCB Layout and Assembly Errors Distort Pressure Readings?

Temperature gradients, board stress, port blockage, and power noise are common causes of readings that look like sensor drift. These errors can pass a basic communication test because the component remains electrically alive. Validation must therefore compare pressure output with physical conditions and assembly state.

Error Observed Behavior Verification Corrective Action
Heat source nearby Warm-up drift or load-dependent offset Compare readings before and after local heating Increase spacing, reduce heat flow, or add approved isolation slots
PCB bending Offset changes with screws, enclosure pressure, or handling Measure before and after assembly torque Move the sensor or change mechanical support
Blocked port Slow response, trapped pressure, or fixed reading Inspect the opening and apply controlled pressure steps Revise coating, cleaning, gasket, or enclosure process
Supply ripple Periodic noise correlated with switching activity Probe supply and output at the same time Improve decoupling, routing, filtering, or regulation
Incorrect conversion Stable but scaled or offset result Compare raw codes with the datasheet transfer function Correct units, coefficients, byte order, or ADC reference
Moisture or residue Intermittent drift, slow recovery, or leakage Inspect under magnification and repeat after controlled drying Improve cleaning, drying, venting, and protection

Panel separation is another risk. Router or breakaway stress can shift package offset after calibration if the sensor sits near a tab. If a board-level offset is stored before depaneling or final enclosure assembly, the stored correction may no longer represent the finished unit.

Where Are Absolute Pressure Sensors Used?

Absolute sensing is used when the result must be independent of the changing atmospheric reference. The same reference principle serves many products, but pressure range, media, bandwidth, environmental protection, and required uncertainty differ widely.

  • Barometric measurement: Atmospheric pressure is measured against vacuum for weather observation and environmental compensation.
  • Altitude estimation: Changes in atmospheric pressure support altitude or vertical-motion calculations in portable, aviation, and navigation systems.
  • Vacuum processes: Sealed chambers, packaging equipment, pumps, and laboratory systems need pressure referenced to true zero.
  • Engine management: A manifold absolute pressure sensor measures intake pressure so control logic can estimate operating load with other inputs.
  • Sealed vessels: Absolute readings help when the surrounding atmosphere must not redefine the process value.
  • Medical and analytical equipment: Controlled gas paths may require compact absolute measurement with documented media and cleaning compatibility.

An application label alone is not enough for selection. A barometric part optimized for clean dry air may not tolerate liquid, corrosive vapor, pressure pulsation, or aggressive cleaning. A rugged industrial transducer may not meet the power, size, or digital-interface needs of a compact embedded board.
How Are Absolute Pressure Sensors Calibrated?

Calibration compares the complete measurement channel with a traceable absolute-pressure reference at defined pressure and temperature points. A single atmospheric reading cannot prove full-range accuracy. The procedure must control leaks, stabilization time, reference uncertainty, pressure direction, temperature, supply, orientation when relevant, and the exact conversion used by the system.

Absolute pressure sensor calibration with a PCB and controlled pressure source
  1. Confirm that the reference instrument and pressure source cover the required absolute range with suitable uncertainty.
  2. Connect the sensor with clean, leak-tight tubing and minimize trapped volume when response time matters.
  3. Power the complete board under its normal supply and allow the specified warm-up and thermal stabilization time.
  4. Apply several increasing pressure points across the working range and record raw output, converted pressure, reference pressure, temperature, and status.
  5. Apply decreasing points to reveal hysteresis, leaks, mechanical effects, or slow pneumatic response.
  6. Repeat at required temperatures when the application uncertainty includes more than room-temperature operation.

  7. Calculate offset, span, linearity, repeatability, and total error using the same rules defined for acceptance.
  8. Store correction coefficients only when the sensor documentation and system architecture support field or board-level calibration.
Zero calibration requires care because a true zero absolute reference is a high-quality vacuum, not an open port. Some devices are calibrated at nonzero points and extrapolated according to their specified transfer function. Never force a zero adjustment at atmospheric pressure on an absolute sensor. That would redefine the output as if atmosphere were zero and destroy the intended reference.
How Should Absolute Pressure Sensors Be Tested and Troubleshot?

Separate electrical communication, pressure delivery, thermal behavior, and calibration before replacing the sensor. A wrong reading can come from a blocked port, leaking tube, incorrect reference type, conversion bug, unstable supply, assembly stress, or damaged device. Random replacement hides the failure mechanism and can leave the same system error in place.

  • Check identity and status: Read the device ID, status bits, and raw output before applying software correction.
  • Verify supply integrity: Measure voltage and ripple at the sensor pins during the failing condition.
  • Inspect the pressure path: Look for coating, residue, pinched tubing, leaks, gasket misalignment, and trapped liquid.
  • Apply known steps: Use at least two controlled absolute-pressure points to distinguish a fixed offset from a dead or saturated response.
  • Compare raw and converted data: Confirm byte order, signed arithmetic, coefficients, units, ADC reference, and ratiometric assumptions.
  • Test temperature influence: Observe warm-up and controlled temperature changes without touching or bending the board.
  • Check assembly stress: Compare the bare PCB, secured assembly, and fully closed enclosure using the same pressure.
  • Review drift evidence: Use time-stamped reference measurements instead of judging drift from unrelated field conditions.

Production validation should include both electrical and pneumatic coverage. An automated test can confirm communication and plausible ambient output, but that does not prove sensitivity across the range. A controlled pressure point or leak-tested pneumatic fixture provides stronger coverage. The acceptance limits must include reference uncertainty and stabilization behavior so good units are not rejected by the fixture itself.

FAQs About Absolute Pressure Sensors

Q1: What does an absolute pressure sensor measure?

A1: It measures pressure relative to absolute zero pressure, using a sealed vacuum reference. The reading therefore includes atmospheric pressure when the sensing port is exposed to air.

Q2: Why does an absolute sensor show about atmospheric pressure in open air?

A2: Open air is not zero absolute pressure. The sensor compares air with its vacuum reference, so a value near local barometric pressure is expected.

Q3: Can absolute pressure be negative?

A3: A true absolute pressure cannot be below zero. A negative displayed result indicates conversion, offset, calibration, or reference errors, not a physical pressure below perfect vacuum.

Q4: Can an absolute pressure sensor replace a gauge sensor?

A4: Not without accounting for atmospheric pressure. The two devices use different zero references, so identical numeric ranges do not make them interchangeable.

Q5: What is a barometric absolute pressure sensor?

A5: It is an absolute sensor optimized for the atmospheric range. Its fixed vacuum reference allows barometric pressure and altitude-related changes to be measured.

Q6: Does an absolute pressure sensor need a vent?

A6: It needs a path for the process pressure to reach the sensing side, but its reference side is sealed against vacuum rather than vented to atmosphere.

Q7: Can two absolute sensors measure differential pressure?

A7: Their readings can be subtracted, but combined offset, drift, timing, and temperature errors may exceed those of one purpose-built differential sensor.

Q8: What output interfaces are available?

A8: Common choices include ratiometric voltage, conditioned voltage, current, I2C, and SPI. The correct option depends on distance, noise, power, conversion, and diagnostic needs.

Q9: How often should an absolute pressure sensor be calibrated?

A9: The interval depends on required uncertainty, drift, environment, duty cycle, and quality history. Set it from documented stability and reference checks, not a universal schedule.

Q10: What causes a slow absolute pressure response?

A10: Restricted ports, long narrow tubing, trapped volume, filters, condensation, leaks, or digital averaging can slow the result. Test the pneumatic path and software filter separately.

For support with a PCB that integrates absolute pressure sensors, contact EBest Circuit at sales@bestpcbs.com and provide Gerber or ODB++, BOM, quantity, stackup, assembly, programming, pressure-interface, and test requirements.

You may also like

High-Power Prototype Board for Passive Rectifier Design and Testing

July 31st, 2026

A high-power prototype board for a passive rectifier must carry capacitor-charging pulses without excessive voltage drop or overheating. It must also maintain the required insulation distances and provide guarded measurement access. Size the board from quantified input, load, surge, fault-energy, thermal, and test-duration limits.

In a capacitor-input rectifier, the diodes conduct near the AC waveform peaks rather than throughout each half-cycle. These narrow pulses raise RMS current, connector and copper loss, diode heating, inrush stress, and loop-induced overshoot above what an average DC-load calculation predicts.

high-power prototype board for a passive rectifier with capacitors, copper busbars, fuse, and heat sink on a white background

What Is a High-Power Prototype Board for a Passive Rectifier?

The board integrates the complete rectifier power path. It may carry a bridge or discrete diodes, a reservoir capacitor bank, fuses, inrush limiting, transient suppression, discharge resistors, current shunts, terminals, heat sinks, and guarded test points. Tests must establish output voltage and ripple, repetitive and surge-current capability, component temperatures, insulation integrity, and repeatable assembly.

What Input, Output, and Load Requirements Must Be Set Before Design?

Set worst-case electrical, thermal, and fault limits first. Nominal voltage and average output current do not cover input tolerance, waveform frequency, output ripple, startup charging, overload duration, cooling, enclosure conditions, or available short-circuit energy.

  • AC input: Record minimum, nominal, and maximum RMS voltage; frequency; number of phases; source impedance; isolation method; and expected transient category.
  • DC output: Define no-load and full-load voltage, allowable ripple, polarity, stored-energy limit, and whether the load tolerates an unregulated output.
  • Load profile: Separate continuous current, repetitive peak current, short-duration overload, regenerative behavior, and load steps.
  • Startup condition: State whether the capacitor bank may be discharged at turn-on and how often the unit can restart.
  • Environment: Specify maximum ambient temperature, airflow, altitude, pollution degree, humidity, enclosure orientation, and nearby heat sources.
  • Acceptance limits: Set maximum diode case temperature, capacitor surface temperature, busbar or terminal rise, output sag, ripple, and permitted test duration.

For a large transformer, mains-derived source, generator, or high-current secondary, define source isolation, available fault current, stored energy, discharge time, guarding, and the conditions that require protective earth.

For a sinusoidal single-phase source, bridge, and reservoir capacitor, the approximate no-load DC bus is the AC peak minus two conducting-diode drops: VDC ≈ √2 × VAC,RMS − 2VF. This estimate assumes the capacitor charges close to the waveform peak. Under load, transformer regulation, wiring resistance, diode conduction angle, capacitor ESR, and source impedance reduce the result. Use minimum input to check output compliance and maximum input to check voltage stress.

The load definition should also identify the actual current return. If a downstream converter draws narrow pulses, its local input capacitor and the rectifier capacitor interact through the wiring inductance. Testing only with a steady resistor may hide instability or peak-current stress that appears with the final electronic load.

How Do Passive Rectifier Topologies Affect High-Power Prototype Board Design?

Topology determines conduction loss, ripple, and loop geometry. Diode count and transformer use change the voltage and current stress on the source, semiconductors, copper, capacitors, and thermal system.

Topology Conducting Path Transformer Requirement Output Character Board Impact
Half-wave One diode per pulse Single winding Line-frequency ripple and poor source utilization Simple layout, but larger filtering and asymmetric source current
Center-tapped full-wave One diode and half the secondary per pulse Center-tapped secondary with matched half-windings Twice-line-frequency ripple Lower diode-path drop, higher diode reverse-voltage demand, three winding connections
Single-phase bridge Two diodes per pulse Single secondary winding Twice-line-frequency ripple Compact general-purpose solution; two forward drops and concentrated bridge heating
Three-phase six-pulse bridge Two diodes conduct at a time Three-phase source Six charging pulses per AC cycle and a shorter capacitor-discharge interval Six diode branches, three phase terminals, phase-to-phase spacing, and package-dependent heat concentration

A single-phase bridge is often practical because it needs no center tap and uses both half cycles. Two diode drops can nevertheless create substantial loss at high current. For a continuous DC load, Pbridge ≈ 2 × VF × Iload is only a first estimate. Final loss should use the device’s forward-voltage curve and the measured or simulated diode-current waveform because capacitor-input conduction is pulsed.

A three-phase bridge spreads conduction among six devices and raises ripple frequency, but also requires six high-current branches. Its phase terminals, fusing, heat-sink isolation, current sensing, and guarded probe points must accommodate phase-to-phase voltage and the physical spacing of three input conductors.

Which Construction Method Is Suitable for a High-Power Prototype Board?

Match construction to current, heat, voltage, and mechanics. A two-layer FR-4 high-power prototype board is suitable only when its finished copper geometry, joints, spacing, and measured temperature rise meet the design limits. As current or stored energy increases, heavy copper, bolted busbars, or a hybrid board-and-chassis structure may provide a more controllable current path.

Solderless breadboards, generic stripboard, and loose jumper wires should be excluded unless their documented current capacity, contact resistance, insulation spacing, and fault behavior cover the intended test. For higher-energy work, use a purpose-built PCB, a bolted fixture, or a chassis-mounted assembly with defined conductors and guarded terminals.

Construction Current Path Modification Boundary Thermal Path Appropriate Validation Scope Main Limitation
Standard FR-4 PCB Wide traces and planes Components can be reworked; copper geometry requires a new board Trace and terminal temperature depend on finished copper geometry, board construction, and airflow Topology and layout when measured conductor and terminal temperatures meet the limits Trace neck-downs, vias, and connectors may set the current limit
Heavy copper PCB Thicker etched copper Components can be reworked; copper geometry and spacing require new fabrication Thicker copper lowers trace resistance at the same width; spreading remains layout-dependent Compact high-current paths after fabricator DFM and thermal validation Etching, spacing, soldering, and cost need early DFM review
PCB with bolted busbars Busbars carry the main current; PCB supports control and connection Bolted bars are replaceable when joints remain accessible Resistance and heating depend on bar material, cross-section, overlap, surface condition, and joint torque When etched-copper loss or board area is limiting and bolted joints can be qualified Joint resistance, torque, flatness, and mechanical support require control
Chassis-mounted power stage Wires or busbars between mounted components Wiring and busbars can be reworked; mounting changes require mechanical review Power packages can couple directly to a heat sink or chassis through a specified interface Large packages, substantial dissipation, or guarded high-energy testing Less compact and harder to convert directly into production PCB geometry
Solderless or generic stripboard Spring contacts or narrow strips Connections are easy to change but are not a repeatable power interconnect Contact resistance and temperature rise are uncontrolled unless the manufacturer rates the exact assembly Only low-energy checks within documented ratings Usually lacks verified spacing, current capacity, and fault-interruption behavior for this application

Match the production current path to the measurement objective. A thin-trace PCB cannot validate the voltage drop or temperature rise of a production busbar, while an oversized hand-built busbar can hide final routing, joint, and assembly constraints.

How Should Rectifier Diodes, Capacitors, and Protection Components Be Selected?

Select parts from actual waveforms and temperatures. Use manufacturer curves at the intended case and ambient temperatures. Forward drop, allowable current, surge withstand, thermal resistance, capacitor ripple rating, expected life, and fault survival all change with waveform and cooling conditions.

  • Reverse voltage: Rate each diode above the highest repetitive reverse voltage, including source tolerance and credible transients.
  • Forward current: Check average, RMS, and repetitive peak current at the intended case temperature rather than using the headline current alone.
  • Surge current: Compare the non-repetitive surge rating with capacitor charging and fault conditions, including the waveform duration stated in the datasheet.
  • Forward loss: Use the forward-voltage curve at the expected pulse current to estimate diode heating.
  • Capacitor ripple: Confirm RMS ripple-current capability, ESR, temperature rating, lifetime model, voltage margin, and mechanical vent clearance.
  • Protection coordination: Select fuses, breakers, NTC limiters, precharge resistors, MOVs, TVS devices, and discharge resistors as one energy-control strategy.

For a single-phase, full-wave, line-frequency capacitor-input supply, a first estimate is C ≈ Iload ÷ (2 × fline × ΔV), where ΔV is the permitted capacitor discharge between charging peaks. The approximation assumes nearly constant load current and does not predict conduction angle, charging-current peaks, ESR heating, transformer copper loss, or startup surge. Confirm peak and RMS currents by waveform simulation or staged measurement.

Capacitor ESR loss is estimated by Pripple ≈ Iripple,RMS2 × ESR. ESR changes with frequency, temperature, and aging, so use the selected series’ data at the relevant conditions. Parallel capacitors can share ripple and reduce effective ESR only when copper geometry, part tolerance, thermal exposure, and connection resistance support balanced current.

An NTC limiter is simple, yet it may remain hot and provide little protection during a rapid restart. A resistor-plus-bypass relay or contactor can provide controlled precharge for a larger capacitor bank, but the bypass timing and failure state must be tested. The fuse must interrupt the available fault current at the applied voltage; its current rating alone does not prove safe interruption.

How Should Copper Weight, Trace Width, Vias, and Busbars Carry High Current?

Size the entire current path, not only its copper traces. Include planes, plated holes, solder joints, terminals, and busbars in resistance, temperature-rise, voltage-drop, fault-current, and manufacturability checks. IPC-2152 data can support high-current PCB conductor estimates, but IPC lists the document as no longer maintained. It cannot replace the applicable product standard, fabricator data, or prototype thermal testing.

Calculate the DC resistance of each uniform copper segment from R = ρL ÷ (w × t), using copper resistivity at the relevant temperature. Estimate conductor loss with P = IRMS2R. Include charging pulses in the RMS value and add via, solder-joint, fuse-clip, connector, cable-lug, and busbar-interface resistance instead of treating etched copper as the whole path.

  • Copper weight: Select finished copper thickness with the fabricator; plated outer layers and etched feature tolerances affect the final geometry.
  • Trace width: Use planes or broad polygons for power paths, but preserve required spacing and avoid neck-downs at pads and terminals.
  • Layer sharing: Parallel copper on multiple layers can lower resistance only when current transfers through a deliberate, adequately plated via pattern.
  • Via arrays: Treat each via as a plated barrel with manufacturing tolerance; distribute arrays to avoid a single hot transfer point.
  • Busbar joints: Control overlap area, surface condition, flatness, washer stack, torque, insulation, and strain relief.
  • Current measurement: Use a defined shunt or four-wire measurement points instead of estimating path resistance from distant voltage nodes.

Do not use solder buildup to compensate for undersized copper; solder has higher resistivity than copper and an uncontrolled finished thickness. Specify any external copper bar or wire reinforcement in the fabrication and assembly drawings with its material, cross-section, attachment, insulation, and inspection criteria.

How Should the High-Current Rectifier Loop and Power Components Be Laid Out?

Minimize the bridge-to-capacitor charging-loop area. In a capacitor-input rectifier, this pulsed loop runs from the transformer or AC connector through the conducting diode pair to the reservoir capacitor and back to the source. Excess inductance increases ringing and overshoot; unequal branch impedance distorts current sharing.

  1. Trace the pulse loop. Mark the source terminal, conducting diode pair, reservoir-capacitor terminals, and source return on the schematic and PCB. This identifies the copper that must enclose the smallest practical area.
  2. Couple bridge and capacitor. Place the bridge DC terminals and reservoir-capacitor terminals in the same power region with direct, wide copper between them. Do not send this path through a connector, test point, long neck-down, or board-edge detour.
  3. Take the load at the capacitor. Route both outgoing DC conductors from the capacitor connection points. A load takeoff in the middle of the charging path makes pulse current share copper with load current and adds ripple-related voltage error.
  4. Pair forward and return paths. Use adjacent planes or closely spaced conductors with uninterrupted reference geometry where insulation rules allow. Avoid slots, split copper, and widely separated routes that enlarge loop area.
  5. Control every layer transfer. Use distributed via arrays and full-width pad entries at high-current transitions. A single via, thermal-relief spoke, or pad neck-down can dominate resistance even when the surrounding plane is wide.
  6. Balance parallel branches. Match copper length, width, via count, joint count, and cooling for parallel diodes or capacitors. Place shared connection points symmetrically; equal part numbers do not correct unequal interconnect impedance.
  7. Place protection in series with the fault path. Locate the fuse, inrush limiter, or precharge path before the vulnerable downstream copper. Keep hot limiters and fuse clips away from electrolytic capacitors, plastic connectors, and temperature-sensitive sensing parts.
  8. Separate sensing from power joints. Run Kelvin traces from the actual diode, shunt, or capacitor terminals. Do not sense through a bolted joint, fuse clip, connector pin, or shared high-current pad whose resistance changes with temperature and torque.
  9. Check the assembled three-dimensional path. Verify that heat-sink tabs, mounting screws, washers, standoffs, and busbars cannot short a node, reduce creepage, obstruct airflow, or place mechanical load on a solder joint.

Measure ringing before selecting a snubber. Probe at the bridge or diode terminals with a suitably rated differential probe and the shortest practical connection. Record peak voltage and ringing frequency, then calculate and tune the RC network for that measured parasitic response. Recheck diode stress, snubber-component temperature, and input current because a generic capacitor across the bridge can increase loss without controlling the actual resonance.

How Should Creepage, Clearance, and Heat Dissipation Be Controlled?

Set insulation spacing and thermal paths from verified limits. Clearance is the shortest distance through air; creepage is the shortest distance along an insulating surface. Working voltage, impulse stress, insulation type, pollution degree, material group, coating, and altitude determine the required values.

Start with the product’s governing safety standard and high-voltage PCB insulation architecture. For equipment within its scope, IEC 60664-1:2020 with Amendment 1:2025 provides insulation-coordination principles for low-voltage systems; the applicable end-product standard still controls the final design. Identify hazardous, accessible, earthed, floating, and isolated nets, then inspect conductor edges, component leads, heat-sink hardware, fuse clips, mounting holes, slots, connector bodies, and the assembled three-dimensional path. A routing rule alone cannot find every reduced distance.

For a steady-state first estimate, use TJ ≈ TA + Ploss × RθJA only when the datasheet’s board, copper, and airflow conditions resemble the assembly. A heat-sunk device is better modeled with junction-to-case, interface, and sink-to-ambient resistances. Copper spreading, thermal vias, a heat sink, a chassis interface, or forced air must be represented in the prototype and confirmed by measurement.

  • Heat separation: Keep hot bridge heat sinks and precharge resistors away from electrolytic capacitors and plastic connectors.
  • Thermal vias: Use an array only when the receiving layer has enough copper area to spread the heat.
  • Heat-sink isolation: Confirm whether the package tab is electrically live and specify any pad, shoulder washer, or isolated mounting hardware.
  • Ventilation: Preserve the capacitor vent path and the airflow channel through heat-sink fins.
  • Temperature sensing: Attach thermocouples consistently and account for measurement error from airflow, adhesive, and electrical potential.

How Should a High-Power Prototype Board Be Fabricated and Assembled?

Preserve copper, spacing, joint quality, and support. Reject over-etched neck-downs, inadequate hole plating, incomplete wetting on heavy copper, loose terminals, board warpage, and unsupported capacitors.

high-power prototype board assembly with torque-controlled fastening of a high-current terminal
  1. Release controlled production data. Supply Gerber or ODB++, drill data, stackup, finished copper requirements, netlist, fabrication notes, and a drawing that identifies controlled high-current features.
  2. Complete power-board DFM. Review heavy-copper etching, minimum spacing after etch compensation, plated-hole aspect ratio, annular rings, solder-mask dams, slots, and finished board thickness.
  3. Verify exact footprints. Check the selected diode, bridge, capacitor, fuse, terminal, shunt, heat sink, and mounting hardware against their current datasheets.
  4. Define measurable acceptance evidence. Use coupons or inspection records for finished copper, neck-down width, hole plating, and critical insulation dimensions when the risk requires verification.
  5. Inspect the bare board. Check opens, shorts, copper defects, hole quality, cleanliness, solder-mask registration, and dimensions before components conceal the features.
  6. Control assembly sequence. Install low-profile parts before power semiconductors, terminals, capacitors, busbars, heat sinks, and mechanically retained components.
  7. Qualify the soldering process. Deliver enough heat to wet heavy copper without scorching laminate, degrading parts, or leaving incomplete through-hole joints.
  8. Control bolted joints. Apply the specified torque and approved washer, thread-locking, and insulation stack to electrical terminals and heat-sink hardware.
  9. Inspect the finished assembly. Verify polarity, diode orientation, capacitor vent clearance, solder wetting, busbar alignment, cleanliness, and conductor spacing.
  10. Start with low-energy checks. Complete continuity, isolation, resistance, and low-voltage functional tests before connecting the intended high-energy source.

Record every manual reinforcement, selective-soldering requirement, torque value, thermal compound, insulating pad, staking material, and inspection point. Undocumented technician adjustments make the assembly result non-repeatable.

How Does a Passive Rectifier Prototype Perform Under Full Load?

A passing prototype must meet every preset limit. Reaching the target current for a few seconds does not prove continuous capability. Test cold start, thermal soak, minimum and maximum input, intended load dynamics, restart behavior, and safe shutdown against predetermined electrical, thermal, and protection limits.

Passive rectifier full-load test with a guarded prototype board, electronic load, oscilloscope, and thermal camera
  1. Secure the test area. Inspect the de-energized setup, discharge capacitors, verify polarity, confirm protective earth where applicable, and place the board behind a suitable guard.
  2. Limit first-energization energy. Use a current-limited isolated source or controlled low-energy source with the intended fuse and precharge path installed.
  3. Establish the no-load baseline. Measure DC voltage, polarity, residual current, discharge time, and unexpected heating before adding load.
  4. Increase load in planned steps. Record RMS input current, DC output voltage, ripple, diode or bridge temperature, capacitor temperature, and terminal temperature at each step.
  5. Check current-path balance. Measure voltage drop across high-current joints and compare parallel branch currents when the design uses parallel devices or capacitors.
  6. Complete the thermal soak. Hold full load until temperatures approach a stable plateau or the planned time limit is reached; stop at any predefined safety limit.
  7. Test the operating corners. Repeat at minimum and maximum specified input with the real load profile or a representative dynamic electronic-load program.
  8. Verify restart behavior. Test cold restart, hot restart, and the permitted restart interval to confirm inrush-limiter recovery and fuse coordination.
  9. Capture transients safely. Measure switching or commutation overshoot with correctly rated probes and a controlled grounding method.
  10. Inspect after shutdown. Verify capacitor discharge, then check discoloration, odor, loose hardware, solder damage, insulation tracking, and changed joint resistance.

Efficiency alone can hide a localized defect. A board may show acceptable total loss while one fuse clip, via transition, or busbar joint runs much hotter than adjacent copper. Thermal images are useful for locating patterns, but emissivity and reflections can distort readings; confirm critical points with an appropriate contact measurement.

Why Do High-Power Prototype Boards Fail, and How Can the Design Be Improved?

Correct the measured mechanism, not only the damaged part. Common causes include underestimated pulse current, concentrated resistance, insufficient insulation, poor heat transfer, and applying full energy before low-power checks.

Failure Symptom Likely Mechanism Verification Design Improvement
Bridge overheats although DC load current is below the catalog headline rating High forward drop, narrow charging pulses, inadequate heat sink, or poor interface Measure diode waveform, case temperature, and heat-sink temperature Recalculate pulsed loss, improve thermal interface, or select a lower-loss topology or package
Fuse opens during startup Capacitor inrush exceeds fuse time-current behavior Capture startup current and compare with fuse curve Add coordinated precharge or choose a correctly rated fuse without weakening fault protection
Capacitors run hot Excess ripple current, high ESR, unequal sharing, or bridge heat exposure Measure branch ripple and capacitor surface temperature Use suitable ripple-rated parts, symmetric copper, more separation, or a revised filter
Copper or terminal discolors Neck-down, poor solder joint, loose bolted joint, or undersized connector Four-wire voltage-drop and thermal comparison Increase cross-section, correct joint design, specify torque, and add mechanical support
Overshoot or ringing damages diodes Commutation-loop inductance, diode reverse recovery, or uncontrolled parasitic resonance Use a safe high-bandwidth differential measurement Shrink the loop and tune a measured snubber rather than adding a generic capacitor
Arcing or carbon tracking Inadequate creepage or clearance, contamination, altitude, or transient stress Inspect the assembled three-dimensional path and governing standard inputs Increase spacing, add a justified slot or barrier, improve cleanliness, and reassess insulation coordination

After any change, repeat the tests affected by that change. Widening a busbar may alter current sharing; moving a capacitor may enlarge the charging loop; adding a heat sink may reduce creepage; changing the NTC may alter hot-restart protection. Preserve waveform captures, temperatures, input conditions, load steps, photos, and revision identifiers so the next prototype is based on evidence rather than memory.

FAQs About High-Power Prototype Boards for Passive Rectifier Design and Testing

Q1: Can a solderless breadboard be used for an initial high-power rectifier test?

A1: No—use it only for isolated, low-energy checks within its documented ratings. Spring contacts and narrow internal strips generally lack documented high-current and insulation performance for this application. Use a purpose-built PCB, bolted fixture, or chassis-mounted test assembly with fusing and guarded terminals.

Q2: Should the high-power prototype board use the same copper construction as the production board?

A2: Match the production current path as closely as the test objective requires. A thin-copper prototype cannot validate the temperature rise of a future heavy-copper board, while an oversized busbar can conceal production constraints. Document every construction difference and limit the conclusions drawn from it.

Q3: Is a bridge rectifier’s catalog current rating enough for selection?

A3: No—the usable current depends on waveform and case temperature. Check average, RMS, repetitive peak, and non-repetitive surge current, plus forward-voltage and thermal curves. Capacitor-input supplies can produce diode-current peaks well above the DC load current.

Q4: When is a busbar preferable to thicker PCB copper?

A4: A busbar is favored when etched copper cannot meet loss, temperature, space, or joint requirements economically. It can provide a low-resistance path, but overlap area, torque, flatness, insulation, strain relief, and inspection must be designed rather than improvised.

Q5: How can current sharing between parallel rectifier diodes be checked?

A5: Measure each branch under thermal equilibrium with matched low-inductance sensing. Compare branch voltage drop or calibrated shunt current while controlling copper symmetry and cooling. Static forward-voltage matching alone does not prove sharing because temperature changes the diode characteristic.

Q6: Does conformal coating automatically allow smaller creepage distance?

A6: No—spacing reduction requires support from the governing standard and a qualified coating process. Coating type, coverage, cleanliness, cure, inspection, pollution degree, and long-term environment matter. Do not treat generic coating as a substitute for insulation coordination.

Q7: What data should be logged during a thermal soak?

A7: Record input, load, airflow, ambient, component temperatures, and elapsed time together. Include bridge case, heat sink, capacitor body, fuse, terminal, and the hottest copper joint. A temperature without its electrical and cooling conditions cannot support a design limit.

Q8: How should stored energy be handled after a test?

A8: Use a designed discharge path and verify voltage before touching the board. The discharge resistor must be rated for initial power and total energy, and the waiting time must be defined. A visual power indicator is helpful but does not replace a voltage measurement.

Q9: What files should be sent for a rectifier prototype quotation?

A9: Send Gerber or ODB++, drill data, BOM, assembly drawings, stackup, copper requirements, and test criteria. Also include peak and continuous current, maximum voltage, thermal limits, busbar drawings, torque requirements, insulation notes, and any programmed load-test sequence.

Q10: Can full-load testing be replaced by simulation?

A10: No—simulation narrows risk, but hardware testing validates parasitics, joints, cooling, and assembly variation. Use simulation to estimate conduction pulses, ripple, loss, and transients, then confirm them through staged, current-limited testing before applying the maximum-energy condition.

Conclusion

Release the design only after staged energization and a full-load thermal soak. Confirm output voltage, ripple, component temperatures, joint voltage drop, current sharing, overshoot, insulation integrity, restart behavior, and protection operation at the specified input and load limits.

For a high-power prototype board quotation from EBest Circuit, send your Gerber/ODB++, BOM, quantity, stackup, copper and busbar requirements, assembly drawings, and test requirements to sales@bestpcbs.com.

You may also like

How to Read the 4.7k Resistor Color Code and Verify It on a PCB

July 31st, 2026

The standard four-band 4.7k resistor color code is yellow-violet-red-gold. Yellow represents 4, violet represents 7, red supplies the ×100 multiplier, and gold specifies ±5% tolerance. The result is 47 × 100 = 4,700Ω, which is also written as 4.7kΩ or 4k7.

Visual decoding is only the first verification step. Band direction, tolerance, heat discoloration, conformal coating, similar resistance values and parallel PCB paths can all affect the decision. Confirm the value against the schematic and BOM, remove power, discharge stored energy and isolate one resistor lead when an in circuit measurement is inconclusive.

4.7k resistor color code on an axial resistor beside an assembled PCB

What Is the Correct 4.7k Resistor Color Code?

A common four-band 4.7kΩ ±5% resistor uses yellow, violet, red and gold. The first two bands are the significant digits, the third is the multiplier and the fourth is the tolerance. Reading the colors in the wrong direction or confusing red with orange changes the decoded value by a factor of ten.

Band Color Meaning Result
1 Yellow First digit 4
2 Violet Second digit 7
3 Red Multiplier ×100
4 Gold Tolerance ±5%

The nominal resistance is calculated before tolerance is applied. Yellow and violet form 47; red multiplies 47 by 100 to produce 4,700Ω. Gold does not change the nominal value. It defines how far a new resistor may deviate from 4,700Ω under the specified measurement conditions.

Not every 4.7kΩ resistor ends with a gold band. Brown commonly indicates ±1%, red ±2% and silver ±10%. The tolerance band must therefore be decoded separately from the value bands. Package size, power rating and resistor technology cannot be determined from the four value and tolerance colors alone.

Color decoding also cannot distinguish a carbon film part from a metal film or flameproof resistor with complete certainty. Body color and surface finish vary by manufacturer. When noise, pulse loading, safety behavior or long term drift matters, use the full manufacturer part number rather than treating the band sequence as a complete specification.

How Should You Determine the Correct Reading Direction for a 4.7k Resistor Color Code?

Begin at the end where the significant digit bands are grouped more closely together. On many four-band axial resistors, the gold or silver tolerance band is separated by a wider gap and belongs on the right. Five- and six-band parts require more care because both end bands may use ordinary colors.

  1. Inspect the spacing. Look for a wider gap before the final tolerance or temperature-coefficient band.
  2. Check the end color. Gold and silver are normally tolerance colors and do not serve as significant digits.
  3. Decode both directions. Compare the resulting values and reject an orientation that produces an invalid or implausible band role.
  4. Compare the circuit record. Match the result with the reference designator, schematic function, BOM value and approved part number.
  5. Measure when uncertain. Use resistance mode on an unpowered circuit and isolate the component if connected paths affect the result.

Use neutral white lighting and magnification when the colors are unclear. Heat can darken a resistor body, flux residue can add a yellow-brown tint, and conformal coating can create reflections. Do not scrape the coating or damage the resistor merely to improve the view; electrical verification is safer when visual evidence remains ambiguous.

Observation Likely Meaning Next Check
Gold or silver band isolated at one end That end is normally the tolerance side Read from the opposite end
Both directions produce plausible values Visual direction remains uncertain Compare BOM, schematic and measurement
Band colors change with viewing angle Coating reflection or poor lighting Use neutral light and magnification
Body or bands are darkened by heat Value and condition cannot be trusted visually Inspect the circuit and isolate the part

How Do 4‑Band, 5‑Band and 6‑Band Color Codes Represent 4.7kΩ?

Four band codes use two significant digits, while five and six band codes normally use three. A five band 4.7kΩ resistor is decoded as 470 × 10. A sixth band usually adds temperature coefficient information rather than another resistance digit.

Format Typical Sequence Calculation Final Band Role
4-band Yellow, violet, red, gold 47 × 100 = 4,700Ω Gold: ±5%
5-band Yellow, violet, black, brown, brown 470 × 10 = 4,700Ω Brown: ±1%
6-band 5-band value plus TCR band 470 × 10 = 4,700Ω Temperature coefficient

The common five band ±1% sequence is yellow, violet, black, brown and brown. Yellow, violet and black form 470; the first brown band multiplies by 10; the last brown band specifies ±1%. The physical spacing between the multiplier and tolerance bands helps distinguish their roles.

A six band part can add temperature coefficient in parts per million per degree Celsius. That parameter matters in precision dividers, measurement circuits and bias networks that operate across a wide temperature range. Confirm the exact sixth band meaning in the component documentation because the band count does not prove pulse capability, working voltage or long term stability.

A sixth band does not automatically make the component more accurate. A six band resistor can have a wider initial tolerance than another five band part, while providing additional temperature information. Compare the tolerance band, TCR band and datasheet together instead of ranking components by band count.

What Does IEC 60062 Specify About 4.7k Resistor Color Codes?

IEC 60062:2016 with Amendment 1:2019 specifies designation and marking codes for resistor values, tolerances and temperature coefficients. It covers color coding and letter-and-digit forms used to communicate resistance values. The standard explains the marking system; it does not certify that a particular resistor meets every electrical or reliability requirement.

Under the color-code method, each color has a defined digit or multiplier role. IEC 60062 also supports resistance notations that replace a decimal point with a multiplier letter. This makes 4k7 easier to read than a small printed decimal in many schematics and BOMs. Fixed-length numerical markings can express resistance values on suitable components.

IEC 60062 does not establish the actual power rating, maximum working voltage, pulse endurance or operating temperature limit of an unidentified resistor. Those parameters come from the applicable component specification and manufacturer datasheet. IEC 60115‑1:2020 supplies generic terms, inspection procedures and test methods for fixed resistors, but the relevant sectional or detail specification still controls acceptance.

Assembly requirements have a separate purpose. IPC J‑STD‑001J addresses soldering materials and process requirements, while IPC‑A‑610J addresses completed assembly acceptability. Neither proves that a visually correct resistor is electrically 4.7kΩ. BOM control, material identity and an appropriate electrical or functional test are still required.

IEC 60063:2015 has a related but different role: it defines preferred number series for resistors and capacitors. The presence of 4.7 in a preferred series explains the widespread nominal value, but it does not prove the tolerance or condition of an installed component. Marking, preferred value and component performance remain separate acceptance questions.

For production records, identify the standard by revision instead of writing only “per IEC” or “per IPC.” Also record the approved manufacturer part number and datasheet revision. Add any customer specific acceptance criteria separately. This prevents a marking standard from being misused as evidence for power, reliability or assembly quality.

What Resistance Range Does Each 4.7k Resistor Tolerance Allow?

Tolerance converts the nominal 4,700Ω value into an allowable resistance interval. Multiply 4,700Ω by the tolerance percentage, then subtract and add that deviation. Meter accuracy, lead contact, temperature and the component’s specified test conditions must be considered before accepting or rejecting a measured value.

Tolerance Band Minimum Maximum Typical Decision Use
±10% Silver 4,230Ω 5,170Ω Noncritical legacy or general purpose circuits
±5% Gold 4,465Ω 4,935Ω General pullups and nonprecision networks
±2% Red 4,606Ω 4,794Ω Moderate accuracy requirements
±1% Brown 4,653Ω 4,747Ω Precision bias or divider networks
±0.5% Green 4,676.5Ω 4,723.5Ω Tighter measurement and control circuits

For example, ±5% of 4,700Ω is 235Ω, so the allowed interval is 4,465Ω to 4,935Ω. A reading of 4.82kΩ can pass a ±5% requirement but fail a ±1% requirement. The BOM and tolerance band must therefore be known before the same measured value is judged acceptable.

Tolerance is not the same as temperature coefficient or aging stability. A resistor can begin inside its room temperature tolerance and move with temperature or long term stress. For accuracy-sensitive circuits, check initial tolerance, TCR, environmental range, load life performance and any ratio matching requirement together.

Measurement uncertainty must be applied to the instrument result, not ignored after the tolerance calculation. If a meter specifies accuracy as a percentage of reading plus a number of display counts, both terms affect a borderline result. Clean probe contact and a stable temperature are also necessary before a component near the limit is rejected.

How Can You Distinguish a 4.7k Resistor Color Code from 470Ω and 47kΩ?

The multiplier band separates 470Ω, 4.7kΩ and 47kΩ. All three values begin with the digits 4 and 7, but brown multiplies by 10, red by 100 and orange by 1,000. One multiplier-color error changes resistance by a factor of ten.

Resistance Value Bands Multiplier SMD Code
470Ω Yellow, violet, brown ×10 471
4.7kΩ Yellow, violet, red ×100 472
47kΩ Yellow, violet, orange ×1,000 473

Red and orange are easily confused under warm light or a tinted coating. Compare the resistor with a neutral color reference, then use a resistance measurement if the decade remains uncertain. An isolated reading near 470Ω, 4.7kΩ or 47kΩ normally separates these values clearly.

An assembled board requires additional caution because a parallel path can pull a 4.7kΩ reading below its tolerance range. A low in circuit result does not automatically identify a 470Ω part. Review the schematic and lift one terminal before deciding that the wrong decade was assembled.

The electrical consequence of a decade error depends on the circuit. With a 3.3V open-drain line held low, ideal pull-up currents are about 7.02mA for 470Ω, 0.702mA for 4.7kΩ and 0.0702mA for 47kΩ. The wrong value can therefore overload a driver or create an excessively slow rising edge.

Bus capacitance makes the difference visible in timing. With a simplified 200pF RC load, the time constant is 94ns for 470Ω, 940ns for 4.7kΩ and 9.4µs for 47kΩ. For I²C, the 30%–70% rise time is approximately 0.8473 × RP × CB, so selection must also satisfy the bus mode rise time limit and the device’s low level sink current limit.

How Do 4k7, 4700Ω, 472 and 4701 Represent a 4.7k Resistor?

All four forms can represent the nominal value 4,700Ω. The formats serve different records and component types. Schematics and BOMs commonly use 4k7, while 4700Ω states the full value. Suitable SMD packages may carry the top marking 472 or 4701.

Marking Calculation Common Context Limitation
4k7 4.7kΩ Schematic or BOM Does not state tolerance by itself
4700Ω 4,700Ω Datasheet or test record Requires a separate rating specification
472 47 × 10² Three digit SMD code Small packages may be unmarked
4701 470 × 10¹ Four-digit SMD code Does not prove power or technology

The letter in 4k7 replaces the decimal point, reducing the risk that a faint dot will be missed. In the three-digit SMD code 472, the first two digits are 47 and the final digit indicates two zeros. In 4701, the first three digits are 470 and the last digit applies a ×10 multiplier.

Do not infer an unmarked SMD resistor value from its pad size or location. Confirm the reference designator, approved BOM, reel label, feeder setup and placement record. Use electrical measurement or functional test when production evidence does not resolve the identity.

During purchasing, keep the engineering value and the orderable part number in separate BOM fields. The engineering value may read 4k7, while the manufacturer part number defines package, tolerance, power, TCR and termination. Converting every field to “472” can remove information and increase substitution risk.

Why Can a 4.7k Resistor Show an Incorrect Reading on a PCB?

A meter connected across an installed resistor measures every conductive path between its probes, not only the resistor body. Parallel resistors, IC inputs, protection devices, semiconductor junctions and connected modules can reduce or destabilize the displayed value. Capacitors can create a changing reading as the meter’s test current charges them.

  • Parallel resistance: another path between the same nodes makes the measured value lower than the isolated resistor.
  • Semiconductor conduction: meter polarity and test voltage can forward bias a junction and alter the result.
  • Stored charge: capacitors can create drift and may leave unsafe residual voltage on the assembly.
  • Probe contact: oxidation, flux, coating or unstable pressure can produce intermittent or high readings.
  • Wrong test state: an energized board can damage the meter or assembly when resistance mode is used.
  • Damaged interconnect: a cracked lead, lifted pad or broken trace can imitate an open resistor.

A lower than expected in circuit reading is common because parallel paths reduce total resistance. A reading above the allowed range is more suspicious, but it still requires contact and interconnect checks. Reverse the probes when semiconductor paths are suspected and compare the result with the schematic before isolating the component.

A simple parallel path shows the scale of the error. A correct 4.7kΩ resistor in parallel with 10kΩ produces approximately 3.20kΩ at the same two nodes. That reading is predictable from the circuit and does not indicate that the 4.7kΩ component has changed value.

A drifting display often indicates capacitance rather than an unstable resistor. The meter injects a small test current, causing the capacitor voltage and displayed resistance to change. Disconnect power, discharge the capacitor safely and wait for the reading to settle before deciding whether component isolation is necessary.

An open display can come from a failed resistor, but it can also result from a cracked lead, damaged via, lifted pad or poor probe contact. Probe directly on the resistor leads when accessible, then compare that result with pad to pad and trace measurements. The difference identifies whether the failure is inside the component or in the interconnect.

How Should You Test a 4.7k Resistor In‑Circuit and Out‑of‑Circuit?

Screen the resistor on the unpowered PCB, then lift one lead only when connected paths prevent a reliable decision. Power must be removed and stored charge discharged before resistance testing, as specified in Fluke’s resistance measurement procedure.

  1. Make the board safe. Disconnect power, batteries, programmers and powered cables. Confirm zero voltage at the test nodes and discharge relevant capacitors.
  2. Identify and inspect the part. Match the reference designator to the schematic and BOM. Check the body, leads, solder joints, pads and nearby components for damage or contamination.
  3. Measure in circuit. Select resistance mode or autorange, contact both resistor terminals and avoid adjacent pads. Record a stable, low, high, open, drifting or polarity-dependent result.
  4. Account for connected paths. Compare the reading with parallel resistors, IC inputs, protection devices and capacitors shown on the schematic. A low or changing value may be a network effect.
  5. Isolate only when necessary. Lift one lead with a controlled rework process if the circuit prevents a clear conclusion. Do not cut a lead or overheat the pad for convenience.
  6. Measure the isolated resistor. Allow the part to cool, clean the contact points and compare the stable reading with the specified tolerance range and meter uncertainty.
  7. Restore and verify the assembly. Resolder the lead, inspect wetting and pad condition, then repeat the resistance check and the circuit function affected by the resistor.
Out-of-circuit test of a 4.7k resistor with probes contacting both leads

An isolated ±5% part should read 4.465kΩ to 4.935kΩ; an isolated ±1% part should read 4.653kΩ to 4.747kΩ. Apply the BOM tolerance and the meter’s uncertainty before accepting a borderline value.

Continuity mode is not a resistance-value test. Its threshold varies by meter, so a beep or silence cannot establish 4.7kΩ, tolerance or component condition.

What Evidence Confirms Whether a 4.7k Resistor Passes or Fails?

A pass decision requires a stable isolated value within the specified tolerance, valid material records and a successful circuit level check. An in circuit reading alone is screening evidence because the meter may include other conductive paths.

Observed Result Likely Explanation Required Action
Stable value inside the isolated tolerance range Resistor value is consistent with its marking Restore the joint and perform the circuit test
Stable low value only in circuit Parallel network path Calculate the network or lift one lead
Reading rises or falls Capacitor charging or semiconductor behavior Discharge, reverse probes and review the schematic
Open at pads but correct on resistor leads Joint, pad, via or trace failure Inspect and repair the interconnect
Stable isolated value outside tolerance Wrong value, damage or excessive drift Verify part identity and replace with an approved part

Four-wire measurement is rarely necessary at 4.7kΩ because test-lead resistance is small relative to the component value. For formal acceptance, record the meter model, calibration status, range, stated accuracy, measured value and test temperature.

PCB inspection process used with BOM and electrical testing to verify a 4.7k resistor

For production, the approved BOM and reel label establish material identity; placement records and AOI verify location and visible markings; ICT, flying-probe or functional testing supplies electrical evidence. Test limits must account for parallel paths, and functional coverage must exercise the affected pull-up, bias, divider or timing node.

FAQs About 4.7k Resistor Color Codes

Q1: Does a 4.7kΩ resistor have polarity?

A1: A standard fixed resistor is nonpolarized. Either lead may face either circuit node, although consistent band orientation improves inspection and manual identification.

Q2: Can two series resistors replace one 4.7kΩ resistor?

A2: Series values may total 4.7kΩ, but the substitution requires engineering approval. Combined tolerance, voltage distribution, power dissipation, footprint, creepage and added solder joints can change reliability.

Q3: Can parallel resistors be used to obtain 4.7kΩ?

A3: Yes, if the calculated parallel value and worst-case tolerance meet the circuit requirement. Verify each resistor’s power, the combined footprint and failure behavior before changing the BOM.

Q4: Can a potentiometer adjusted to 4.7kΩ replace a fixed resistor?

A4: Only when adjustability, wiper failure and drift are acceptable. A potentiometer adds mechanical variability, a different footprint and a possible open wiper failure mode that a fixed resistor does not have.

Q5: Can an SMD resistor replace an axial 4.7kΩ resistor?

A5: Only after electrical, thermal and mechanical review. The replacement must satisfy resistance, tolerance, voltage, pulse energy, power derating, land pattern and rework requirements.

Q6: How can a color-blind technician identify the bands?

A6: Use a calibrated color-identification aid and confirm the value electrically. A BOM, reference designator and isolated resistance measurement are more reliable than unaided color judgment.

Q7: Can an axial 4.7kΩ resistor be mounted vertically?

A7: Yes, when the approved footprint and assembly requirements permit it. Check component height, lead forming radius, mechanical support, electrical clearance and vibration exposure.

Q8: Can a resistor pass an ohmmeter test but fail during operation?

A8: Yes, a room-temperature resistance check does not test every stress. Pulse overload, excessive working voltage, intermittent leads, thermal drift or moisture damage may appear only under operating conditions.

Q9: Can 4.7kΩ be used as an LED current-limiting resistor?

A9: It can, but the resulting current must be calculated. Use supply voltage minus LED forward voltage, divide by 4.7kΩ, then verify brightness and resistor power across tolerances.

Q10: Can a color-banded component be an inductor instead of a resistor?

A10: Yes, some axial inductors also use color bands. Confirm the reference designator, schematic symbol and impedance behavior instead of identifying the component by appearance alone.

Conclusion

The four-band 4.7k resistor color code is yellow, violet, red and gold for a common ±5% part. A reliable PCB decision also requires the correct reading direction, band format, tolerance range, schematic, BOM and measurement state. When connected circuitry changes the reading, isolate one terminal before rejecting or replacing the resistor.

For a PCB or PCBA quotation, send your Gerber or ODB++, BOM, quantity, stackup, assembly details, programming method and test requirements to sales@bestpcbs.com. EBest Circuit will review the manufacturing package and identify component-control, assembly or test details that require confirmation before production.

You may also like