

For a PCB conductor modeled as a constant resistance, average resistive heating follows IRMS²R—not Iaverage²R. A repeating rectangular current that switches between zero and a positive peak has Iaverage = IpeakD and IRMS = Ipeak√D, where D is the duty cycle expressed as a fraction.
That difference matters in switched loads, motor-drive paths and pulsed actuators. It does not mean RMS alone determines a safe trace width. Peak current, pulse duration, repetition, copper geometry, connections and temperature still need review. Start with the actual current waveform in the specific conductor—not the controller’s PWM setting.
Understand Peak, Average and RMS Current
Peak current is the largest instantaneous current magnitude of interest. Average current is the signed mean over the chosen observation interval. RMS means root mean square: square each current value, average those squares, then take the square root. Squaring makes both current directions contribute positively to resistive heating.
For an ideal resistor, a waveform’s RMS value corresponds to the direct current that produces the same average heating. Fluke explains the heating-value basis of RMS measurement. Average current remains useful for other questions, but it is not interchangeable with RMS when evaluating copper loss.
Record the Detailed Waveform Parameters
Duty cycle is on-time divided by period. A 25% duty cycle is D = 0.25, not 25, in the formulas. The off-state current must actually be zero for the simple zero-to-peak equations below; freewheeling and ripple can make that assumption wrong.
| Parameter | Record | Why it matters |
| Peak current | Magnitude and polarity | Instantaneous stress |
| On-time | Seconds or subunits | Pulse energy |
| Period | Full repeating interval | Repetition and RMS |
| Off current | Zero or measured value | Formula validity |
| Burst pattern | Active and idle intervals | Thermal history |
| Path resistance | Temperature and geometry | Loss and voltage drop |
Also record ambient temperature, enclosure airflow, copper construction and the allowable temperature rise. These are project inputs, not fixed universal values or a Best Technology capability table.
Calculate a Zero-to-Peak Rectangular Pulse
Consider a hypothetical conductor carrying 8 A for one quarter of each period and zero for the rest. Its average current is 8 × 0.25 = 2 A. Its RMS current is 8 × √0.25 = 4 A.
Why are the results different? The average calculation weights current directly, whereas heating weights its square. The on-state contributes 8² × 0.25 = 16 A² to the mean square. Taking the square root gives 4 A. The example assumes ideal rectangular pulses and constant resistance; it is not a qualified operating point for any particular PCB.
Compare Equal-Average Waveforms
Three waveforms can deliver the same average current but produce different conductor losses. The following teaching comparison assumes identical constant resistance and sufficient repetition to discuss average electrical loss. It does not predict a temperature rise or approve a peak current.
| Waveform | Mean | RMS | Loss vs 2 A DC |
| 2 A DC | 2 A | 2 A | 1× |
| 4 A, 50% on | 2 A | 2.83 A | 2× |
| 8 A, 25% on | 2 A | 4 A | 4× |
The practical lesson is simple: reducing duty cycle does not make peak current harmless. Compare the full waveform and resulting loss, then investigate transient temperature and the weakest part of the path.
Translate RMS into Copper Loss
If the hypothetical path resistance is 10 mΩ, the 4 A RMS case produces 4² × 0.010 = 0.16 W average resistive loss. Using its 2 A mean would incorrectly predict 0.04 W. The arithmetic explains a fourfold loss difference without claiming the board becomes four times hotter.
Temperature rise depends on heat spreading and cooling, and resistance changes as copper heats. At higher frequencies, current distribution can also make a simple DC-resistance model incomplete. Treat IRMS²R as the defined model here, not as a substitute for the actual electrical and thermal assessment.
Distinguish Repeating Heating from Single-Pulse Stress
A repeating low-duty waveform and one isolated pulse are not the same thermal problem. A long pulse can create a significant local temperature excursion even if an average over a very long idle interval looks small. A short repeating pulse train can accumulate heat if cooling between pulses is limited.
State pulse width, repetition and burst duration together. For an isolated event, evaluate energy and transient response as appropriate. Do not choose a long averaging interval merely to make the reported RMS lower. The observation interval must represent the operating question being answered.
Measure the Current in the Correct Branch
A PWM control signal describes switching commands, not necessarily the current in every copper path. An inductive load can continue carrying current during a switch’s off interval through another route. Capacitors may supply a pulse locally while the input connector sees a smoother waveform.
Draw the current loop for each switching state and identify the exact trace, via or connector under review. Measure or calculate that branch current. Applying the controller’s duty cycle to the input current, load current and switch current indiscriminately can give three plausible-looking but incorrect heating estimates.
Handle Nonzero Off-State Current and Ripple
For a two-level waveform, use IRMS = √[D Ion² + (1 − D) Ioff²]. The simple peak-times-square-root formula is its special case when the off current is zero. Average current is D Ion + (1 − D) Ioff.
For arbitrary measured samples, square the current samples, average over a representative interval and take the square root, with appropriate sampling and time weighting. A waveform with ramps or spikes needs its actual shape represented. Do not force it into a rectangular model solely because the switching command is rectangular.
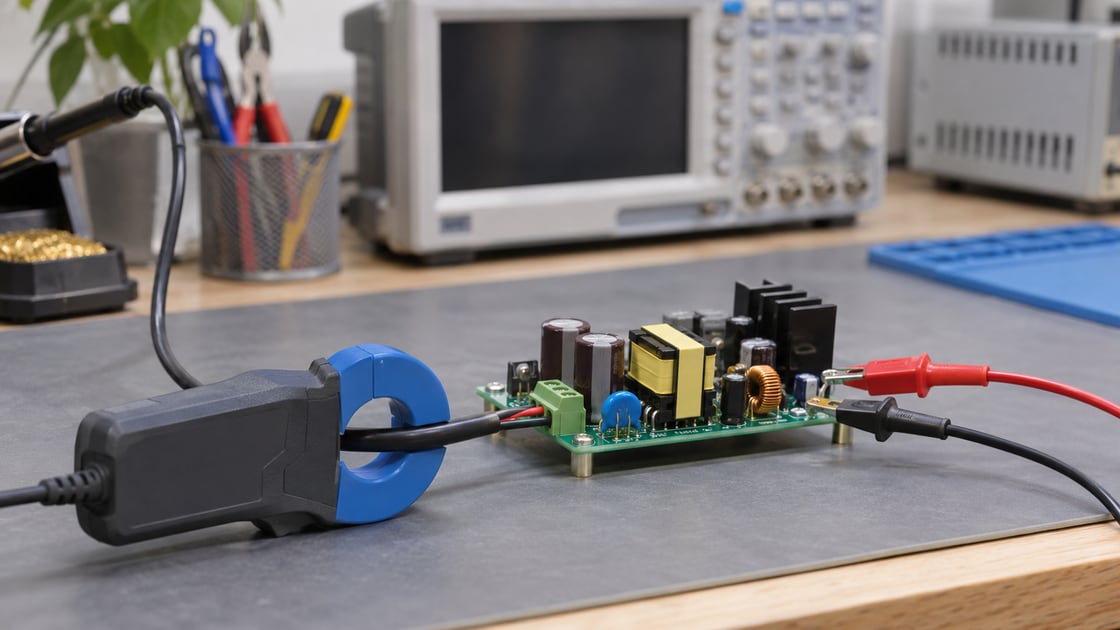
Check Meter Coupling, Bandwidth and Crest Factor
A true-RMS label alone does not guarantee that a meter captures the desired waveform. Determine whether the selected function measures the AC component only or total AC-plus-DC RMS. For a unipolar pulse train, removing the DC component changes the reported result.
Check bandwidth, crest-factor limits, range, probe saturation and sampling interval. Consult the actual instrument manual; the Fluke 287/289 manual, for example, separates functions and frequency-dependent specifications. Use suitable low-voltage test arrangements and qualified personnel. Never put a current-mode meter directly across a voltage source.
Review Neckdowns, Vias and Connections
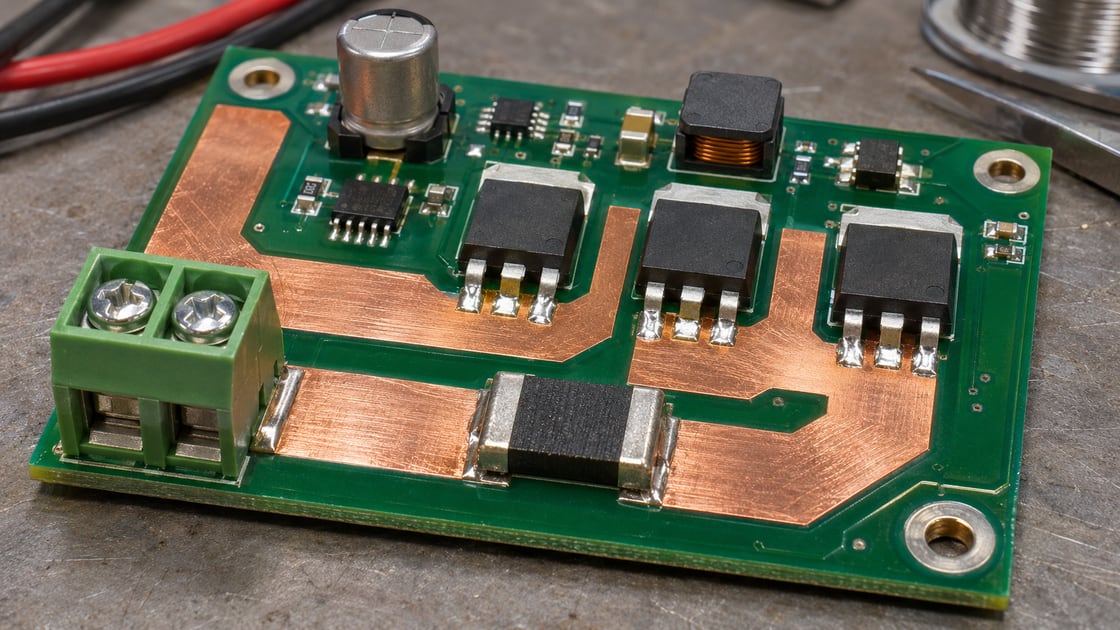
A wide copper pour can feed through a narrow neck, small thermal-relief spokes, a via group or a connector pin. Those local features can govern loss and temperature. Parallel conductors do not necessarily share current equally if their electrical and thermal paths differ.
Review the complete route rather than calculating only its widest section. Record copper thickness, minimum finished width, path length and connection details. The high-current PCB overview provides related construction context; no generic article replaces validation of the actual board and operating cycle.
Do Not Borrow a MOSFET Pulse Rating for a PCB Trace
A component’s pulsed-current rating belongs to that component and its stated conditions. It does not qualify the board, connector or solder joint around it. TI’s discussion of MOSFET pulse-current ratings emphasizes pulse-duration and duty-cycle conditions.
Check each element independently, including component operating limits and the complete current path. A trace that survives a few demonstrations has not thereby established its production margin, lifetime or fault behavior. Separate normal repeated operation, startup surge and fault events in the design review.
Validate the Board with a Repeatable Checklist
- Identify the branch and actual waveform.
- Record peak, RMS, mean, timing and burst conditions.
- Check the formula’s zero-current and constant-resistance assumptions.
- Review every neckdown, via and connection.
- Measure temperature at representative worst-case operation.
- Include enclosure, ambient and startup conditions.
- Record limits, uncertainty and the approved configuration.
Use controlled measurements to connect electrical loss to real temperature. If using infrared inspection, account for surface measurement limitations; see the PCB infrared temperature guide. RMS is a powerful starting point because it addresses the right heating quantity—not because it removes the need for validation.
FAQ
Can I size a pulsed-current trace from average current?
Not as a general heating calculation. For a constant-resistance conductor, average loss depends on mean-square current. Use the actual waveform’s RMS value, then check transient and peak limits separately. Average current can describe charge delivery, but it can substantially understate heating when substituted into the squared-current loss equation.
Does a 25% duty cycle mean one quarter of the heating?
Only under clearly stated comparisons. With the same peak current and constant resistance, a zero-to-peak rectangular waveform has one quarter of the continuous-peak average loss at 25% duty. It does not have the same loss as DC at one quarter of that peak current. Keep the reference case explicit.
Can RMS current alone prove a PCB trace is safe?
No. It estimates resistive heating within a defined model but does not establish allowable temperature, transient stress, connection ratings or failure margin. Evaluate the real geometry, copper construction, cooling and operating history. Peak events and fault conditions need their own review even when the normal RMS value looks modest.
Why does my current meter disagree with the calculation?
Check whether the meter measures mean DC, AC-only RMS or total AC-plus-DC RMS. Also check bandwidth, crest factor, range and probe behavior. Then verify the waveform and measurement interval. A meter and calculation can both be internally correct while describing different components or time windows of the same signal.
Does the PWM duty cycle equal the load-current duty cycle?
Not necessarily. Inductance, freewheeling paths and local capacitors can keep current flowing or move pulse current between branches. Determine the waveform in the actual conductor under review. A controller’s on-time is not sufficient evidence that the trace current switches instantly between zero and a fixed peak.
What if current continues during the off interval?
Include that current instead of using the zero-off shortcut. For two constant levels, average their squared values with their time fractions and take the square root. If the current ramps or rings, integrate or sample the real waveform appropriately. The model should follow the current, not only the switch command.
Can I use a component’s pulse rating as the board limit?
No. The rating applies to that component under its documented conditions. Copper, vias, terminals, solder joints and other parts have separate constraints. Review the entire path and verify the actual pulse timing and thermal environment. One part’s large pulsed-current headline does not qualify the surrounding assembly.
How should I validate a burst that occurs only occasionally?
Record the pulse shape inside the burst, burst duration, repetition interval and initial temperature. Evaluate both local temperature excursion and longer-term heating under the real operating sequence. Do not dilute the event with an arbitrary idle interval. Include plausible repeated commands and startup conditions in the approved validation plan.
References and Question Research
Technical references are the instrument-manufacturer and semiconductor-manufacturer sources linked above. Community discovery included questions about pulsed trace width and pulse current and trace limits. Their anecdotes are not current ratings; the FAQ answers use the stated electrical model and source limitations.
Discuss a High-Current Fabrication Requirement
Send Best Technology the stackup, copper geometry, current waveform, temperature limits and validation requirements at sales@bestpcbs.com. Request a project-specific fabrication review. Any current or thermal performance commitment must be supported by the actual design, agreed construction and validation evidence.