

TDR spatial resolution describes whether two nearby impedance changes can be distinguished, not simply whether a reflection can be detected. Compare their echo separation with the effective step response at the device. A sharp instrument specification or a fine cursor readout does not guarantee two usable peaks on a real PCB.
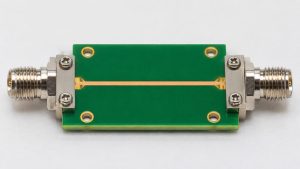
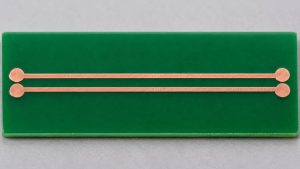
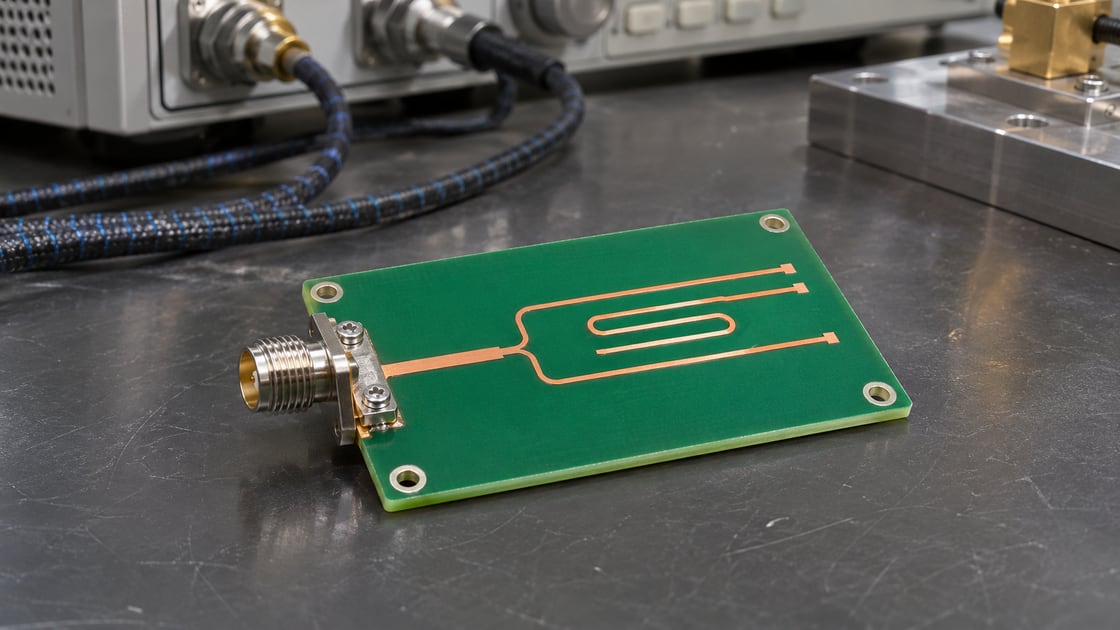
Consider a coupon with two small discontinuities a few millimeters apart. The practical question is whether the setup can report two locations, one combined event, or only a difference from a known reference.
Separate detection from resolution
A time-domain reflectometer sends a step and observes reflections from impedance changes. One visible bump can indicate that something changed without showing how many features contributed. Resolving two features is the stronger claim: the trace must contain enough evidence to distinguish the two responses under the actual measurement conditions.
Record the parameters that set the test
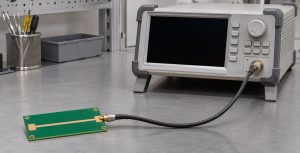
Record time intervals, edge definition, velocity and reference plane before comparing plots. Distinguish the instrument’s specified step from the response available through the cable and launch. The resolution section of Tektronix’s TDR application note explains how step rise time, settling and ringing can cause nearby events to merge.
| Parameter | Record |
| Effective edge | Rise time and threshold convention |
| Echo gap | Interval on the reflection time axis |
| Velocity | Measured or modeled path basis |
| Reference | Calibration or fixture plane |
| Signal quality | Noise, ringing and repeatability |
Compare three different measurement claims
Choose the strongest conclusion supported by the data, not by the instrument’s display precision. A one-feature reference and a controlled two-feature coupon can help separate a real resolution result from a convenient interpretation of a broad trace.
| Claim | Evidence needed |
| An event exists | Repeatable difference from reference |
| Two events resolve | Distinct responses on matched setup |
| Feature sizes are known | Suitable model and validation |
Convert spacing to an echo interval
For two features on the same uniform line with one-way spacing d and propagation velocity v, their first-return spacing is approximately Δt = 2d ÷ v. Use d in mm and v in mm/ns to obtain ns. The formula describes expected timing, not a resolution specification. For absolute location or an instrument distance display, see the TDR fault distance guide.
Test the two-feature teaching example
Assume 3.2 mm spacing and 160 mm/ns velocity. The calculated echo gap is 0.040 ns, or 40 ps. A hypothetical effective 100 ps edge makes overlap a serious concern; a 30 ps edge is a better candidate for separation. Neither example is a pass criterion: amplitudes, polarity, ringing, fixture quality and noise still affect the result.
Treat rise-time rules as screening only
Published heuristics describe when small, similar discontinuities may be separated. Check whether a rule’s timing refers to one-way electrical separation, displayed reflection interval or a specific instrument convention before converting it to length. A known two-feature reference tested with the actual setup is a better basis for making a product-specific resolution claim.
Account for the path before the device
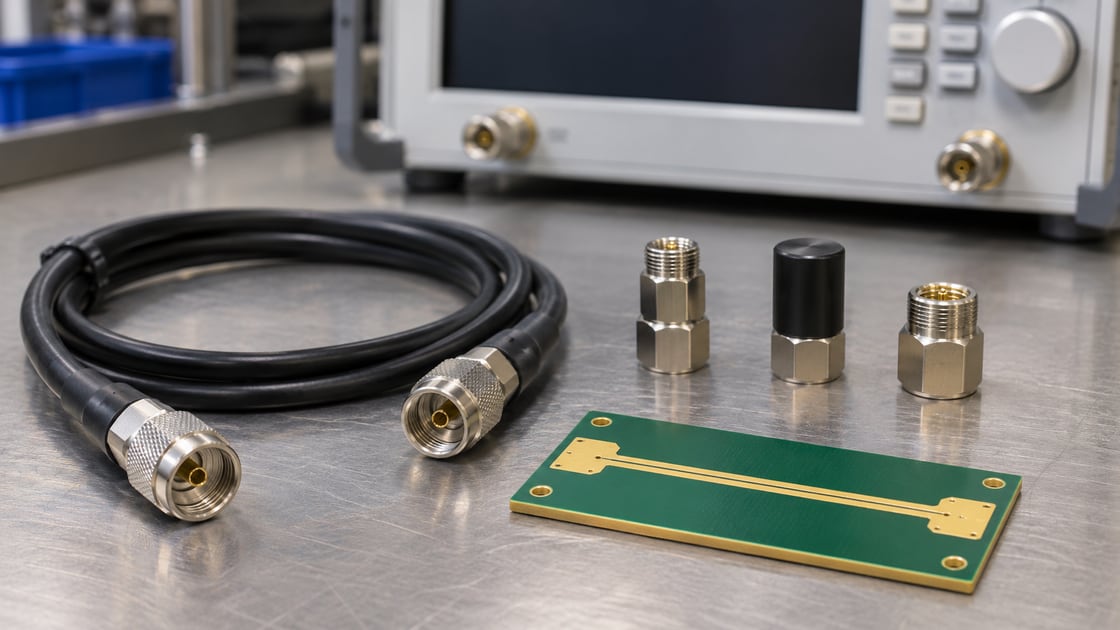
Cables, adapters and a launch can broaden the incident edge or add their own reflections. Document where the test plane is and what fixture treatment was used. If the suspected features are near a strong launch response, compare a reference with the same launch before treating a second shoulder as a separate defect.
Check the effect of polarity and magnitude
Similar reflections can merge into a broader feature, and opposite-polarity contributions can partially cancel. A small event next to a large one can disappear into its tail even when the spacing looks promising. Compare changes relative to an approved reference rather than counting visible peaks as a complete map of the underlying structures.
Avoid confusing oversampling with bandwidth
A small sample interval can produce a smooth plot without recovering detail removed by a slow edge or bandwidth limit. Record acquisition settings, averaging and any filtering. Look for a stable conclusion when settings change within a controlled comparison; do not treat a software zoom or extra digits as a physical improvement.
Use an edge sweep as a diagnostic comparison
If the equipment supports controlled changes in effective edge, compare the same reference plane and coupon at two settings. A shoulder that becomes reproducible as the response improves deserves investigation. Changing the edge also changes how strongly some features appear, so use a reference and do not label the outcome as a universal acceptance threshold.
Validate a coupon against the intended question
For a fabrication test, confirm whether the deliverable is nominal impedance, a controlled discontinuity comparison or a resolution study. A routine coupon designed to measure a long uniform line may not answer the last question. Agree on feature spacing, construction, reference data and criteria before ordering a special verification coupon.
Report uncertainty instead of inventing a second location
State the feature geometry, timing basis, observed edge and what the trace supports. If two returns cannot be distinguished reliably, report a combined or unresolved event and identify the next check. The test can still narrow an investigation without claiming a defect count or location precision beyond the evidence.
FAQ
Does seeing one bump mean there is one defect?
No. A broad response can include multiple nearby discontinuities or a fixture contribution. Compare the expected physical features and a known reference before deciding what the event represents. If the setup cannot reliably distinguish candidates, report the observation as unresolved rather than assigning an exact count.
Can a TDR see a feature smaller than its quoted resolution?
A small feature may change the measured response relative to a suitable reference even when its two boundaries are not separately identifiable. Detection, separation and dimension extraction are different claims. State which one is supported by the evidence and avoid treating a visible difference as a calibrated feature size.
Does averaging make two reflections easier to separate?
Averaging can help with repeatability when noise is the limiting factor. It does not restore bandwidth or remove systematic ringing. Compare the same setup and keep the acquisition settings with the result. If two responses are still inseparable after noise improves, changing the edge or reference may be more useful.
Should I test at the fastest available edge?
Use an edge suited to the question. A fast setting can help identify nearby features, while a slower setting can help assess the response under a different relevant excitation. Record which setting supports each conclusion, and do not use one trace to imply performance at every system edge rate.
Can a VNA time-domain plot answer the same question?
It can support a related investigation if the frequency span, window, calibration and transform are appropriate. Its effective time response is not automatically identical to a direct-step TDR. Compare validated reference structures and report the settings and observable result rather than assuming the two displays are interchangeable.
Is a launch artifact always removed by calibration?
Not if the launch is outside the calibrated plane and remains part of the measured network. A suitable fixture treatment or a matched comparison may be needed. Record the physical plane and which structures remain included, then verify that a changed feature is not simply a different launch response.
Can the impedance coupon prove an assembled channel will pass?
No. The coupon can document behavior of its defined geometry under the measured conditions. An assembled channel includes connectors, components and other transitions, and can have different acceptance criteria. Use coupon evidence for the property it represents and perform appropriate channel verification separately.
What should a report say when separation is borderline?
Include the expected echo gap, effective response, test reference and comparison result. State whether the trace supports detection only or separation under specific conditions. If a decision depends on distinguishing the features, define the next controlled measurement instead of rounding the reported distance to imply greater certainty.
References and Question Research
Controlled-impedance inspection discussion informed the coupon and reference-plane questions; instrument guidance and the stated model support the technical explanation.
Discuss Your Project
For a fabrication or coupon review, send Best Technology the stackup, relevant geometry, test purpose and required evidence at sales@bestpcbs.com. Specify whether the request concerns nominal impedance or a separate two-feature measurement study.