

A Touchstone file stores frequency-dependent network parameters in text form. An .s2p file normally describes a two-port network, with four complex S-parameters at each frequency. Before importing it into a PCB simulation, check the units, data representation, port map and reference impedance; a file that loads successfully can still describe a different setup from the one you intended.
This guide follows a hypothetical passive RF PCB coupon between two connectors. Numerical examples are teaching values, not measured performance. The reference specification is Touchstone 2.1, ratified January 26, 2024; importing software may support a narrower subset.
What an S2P File Tells You—and What It Does Not
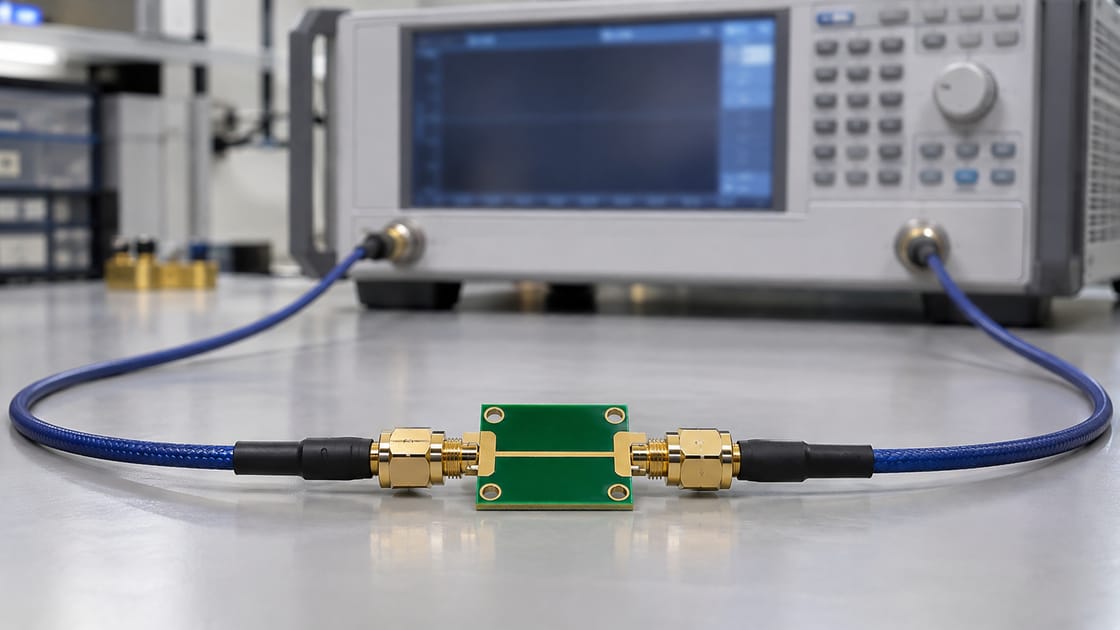
The data describes a network response at specified frequencies and reference conditions, not the complete physical design. For the coupon, S21 describes transmission toward port 2 from excitation at port 1, while S11 describes reflection at port 1 under the parameter definition.
The file may originate from a measurement or a simulation. That origin, the physical port locations and included fixtures need accompanying documentation. The filename alone does not establish temperature, calibration, geometry, manufacturing revision or validation quality. It also does not make a small-signal device model valid for every bias or large-signal operating condition.
Read the Option Line Before the Numbers
The option line explains how to interpret the data. For the example # GHz S MA R 50, read the fields separately rather than assuming a familiar instrument’s export defaults.
| Field | Example | Meaning |
| Frequency unit | GHz | 1 means 1 GHz |
| Parameter type | S | Scattering parameters |
| Pair format | MA | Linear magnitude and angle |
| Reference | R 50 | 50 Ω reference in this example |
| Angle unit | Degrees | Not radians |
Version-specific keywords can affect the interpretation, including reference values and port ordering. Read the complete header and the applicable specification instead of treating this one example as a universal template.
Compare MA, DB and RI Using the Same Complex Value
All three formats can describe the same complex S-parameter, but the two stored numbers mean different things. Keysight’s S-parameter table documentation identifies these supported representations.
| Format | Pair means | Teaching example |
| MA | Magnitude, angle | 0.5, −90° |
| DB | dB value, angle | −6.0206, −90° |
| RI | Real, imaginary | 0, −0.5 |
The example value is −j0.5. Its magnitude in dB is 20 log10(0.5) ≈ −6.0206 dB. These are calculated representations, not three measurement results. Simply changing MA to DB in the header without converting the data changes the meaning of the file.
Check the Special Two-Port Data Order
Do not assume every two-port row is stored in the intuitive S11, S12, S21, S22 sequence. The legacy two-port convention is frequency followed by the S11, S21, S12 and S22 pairs. Versions 2.0 and 2.1 use the applicable [Two-Port Data Order] declaration to identify the permitted order.
For the teaching coupon, manually identify one frequency and its transmission pair, then compare that point with the imported plot. This spot check can catch an ordering mistake before the wrong column becomes a design conclusion. Preserve any original header instead of rearranging columns by visual intuition.
Map File Ports to Physical Connector Locations
A correct numeric matrix still needs a physical port map. Label the coupon ends in the review record, identify signal and reference conductors, and confirm the direction represented by S21. Do not assume the left side of a photograph is always port 1.
For a reciprocal uniform coupon, forward and reverse transmission can look similar, so a reversed connection may not be obvious from one magnitude plot. Connector launches or other asymmetric features can matter when the model is connected to the next network. Keep a simple physical connection sketch with the data, separate from the file’s numeric indexing.
Separate Reference Impedance from the Connected Load
The S-parameter reference defines the wave representation; it does not say that the actual trace has a constant 50 Ω impedance or that every future connected load must equal 50 Ω. The simulator must interpret the file with the correct reference before connecting other circuit elements.
When changing the S-parameter reference, use a valid renormalization operation rather than editing the R value alone. The scikit-rf renormalization example shows that the same physical load has a different reflection coefficient under a changed reference. More advanced complex-reference cases also require attention to wave definitions; do not improvise them from a simple real-resistance example.
Understand Why S4P Does Not Automatically Mean Differential Data
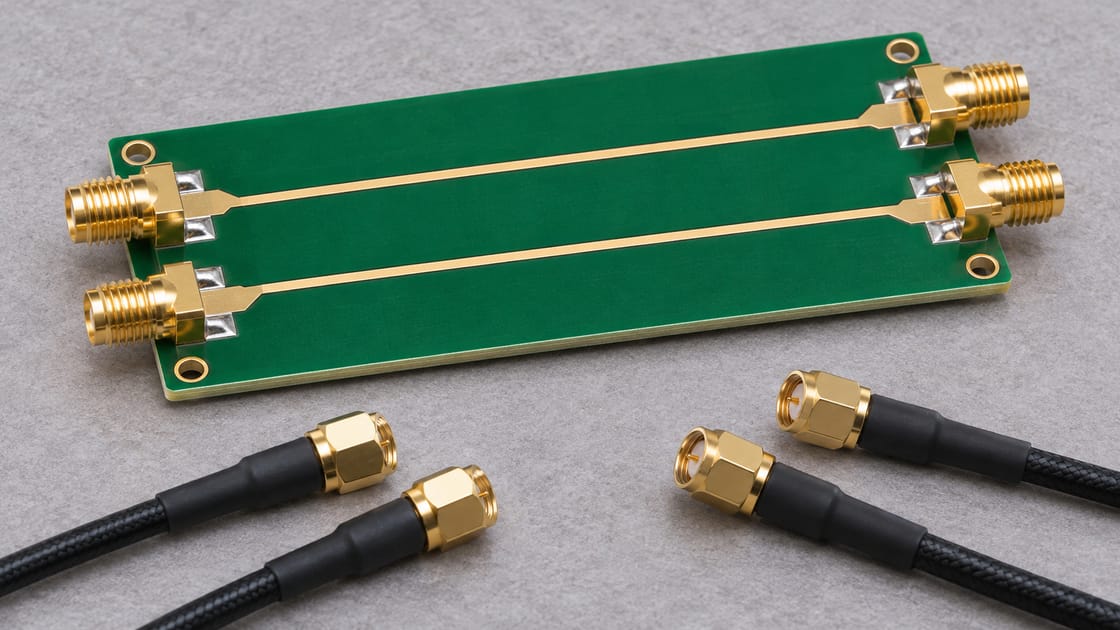
Four ports can represent two single-ended conductors at each end, but that physical arrangement must be established. A four-port file can also describe another network entirely. Even for a differential pair, single-ended data and mixed-mode data require the correct interpretation and pairing.
For a differential version of our coupon, identify the positive and negative conductors at both ends and check the file’s declared mode/order information. A mistaken pairing can produce misleading differential transmission or mode-conversion results. Do not rename .s4p to .s2p to make an import dialog accept it.
Check the Frequency Band and Low-Frequency Treatment
The dataset supports its stated frequency range; behavior outside that range depends on the importing tool’s modeling assumptions. Record the first and last frequencies, point spacing and whether the intended analysis requires extrapolation or a DC estimate.
For the coupon, compare the planned simulation band with the data before running a time-domain analysis. Ask how the tool handles missing low-frequency data, interpolation and high-frequency truncation. A smooth-looking extrapolated curve is not an additional measurement. Keep any fitted or extended dataset distinguishable from the original supplied file.
Identify What the Measurement Reference Planes Include
The model boundary determines which physical effects are already in the data. A coupon file measured at coaxial reference planes may include launches that a trace-only electromagnetic model excludes. Cascading both without checking their boundaries can count the same transition twice.
Ask for the calibration or de-embedding description and a physical definition of each reference plane. For the teaching network, decide whether the connector bodies, launch pads and uniform line are included. This is different from the numerical impedance reference: both need to be correct, but they answer different questions.
Check Physical Plausibility for the Intended Network
Passing a syntax check does not demonstrate passivity, causality, reciprocity or measurement accuracy. A passive coupon and a biased amplifier are different model classes, so the applicable checks must match the object.
Use the simulator’s documented validation tools and investigate suspicious behavior against the original data and measurement setup. Do not judge full multiport passivity solely by looking at one S21 magnitude. Likewise, do not “repair” a model automatically without understanding how the correction changes its response. Save the original and document any authorized fitted or corrected version.
Diagnose an Import Failure Without Corrupting the File
Identify the reader’s supported version and the exact reported problem before altering the data. Common review areas include the option line, frequency units, port count, pair format and required version-specific keywords.
Keep an unchanged original, test the file with a suitable independent reader, and compare at least one known point. If a format conversion is required, use a tool that actually converts the data and preserves the intended network meaning. Deleting unfamiliar header lines until the error disappears can remove information the importer needed to interpret the file correctly.
Release the Dataset with a Short Model Record
A usable handoff includes enough context to connect the network correctly and understand its limits.
- File identity, revision and measured or simulated origin.
- Format version, parameter type and pair representation.
- Frequency range and any fitting or extrapolation.
- Physical port map, reference planes and impedance convention.
- Relevant bias, temperature and construction conditions.
- Import spot check and applicable model validation results.
For interpretation of reflected signals, see the related PCB return loss and S11 guide. Reading the file correctly is the starting point for that interpretation, not proof that the manufactured channel meets its requirement.
FAQ
Can a CSV export be renamed to .s2p?
No. The content must follow the supported Touchstone syntax and contain the required complex network data. A spreadsheet of frequency and one magnitude curve is not a complete two-port network. Use an appropriate export or conversion method, then verify units, ordering and a known data point in the receiving tool.
Why does a file open in one tool but not another?
The tools may support different versions or subsets of the format, or may handle nonconforming input differently. Compare their documented capabilities with the actual header and data. A tolerant reader accepting the file does not prove full conformance, and a rejected file should not be fixed by removing required information blindly.
Can the file contain Y or Z parameters instead of S parameters?
Yes, the declared parameter type matters. Do not interpret every pair in a file as an S-parameter just because the workflow uses the word Touchstone. Check the option line and the receiving tool’s support for that parameter type. A conversion to scattering parameters must use the appropriate definitions and reference conventions.
Does a negative S21 dB value mean negative power?
No. It is a logarithmic representation of the magnitude of a complex transmission parameter under the stated reference definition. In the teaching example, magnitude 0.5 corresponds to about −6.02 dB. Interpreting delivered power additionally requires the relevant network and termination conditions; the sign alone is not a power measurement.
Can I recover phase from a magnitude-only screenshot?
Not as a complete replacement for the original complex dataset. A plot of magnitude omits phase information and usually lacks the full numeric precision and context needed for a network model. Ask for the original file rather than reconstructing a production simulation from a screenshot and assuming the missing phase is zero.
Does an S2P file fully describe an operational amplifier?
Not across every operating condition. Device data depends on how the part was biased, connected and characterized, and a small-signal network description does not replace all nonlinear, stability or supply behavior. Check the manufacturer’s intended model use and conditions before applying a two-port representation to an amplifier circuit.
Should I delete comment lines to improve compatibility?
Only if a documented conversion or troubleshooting step justifies it and the original is preserved. Comments may carry essential human-readable context such as port names or measurement conditions, even when they do not alter numeric parsing. Keep that context in the handoff record rather than stripping it simply to make the file smaller.
Is a supplier’s simulated file equivalent to a measured production coupon?
No. Both can be useful, but they answer different evidence questions. A simulated file depends on the model assumptions; a measurement depends on the specimen and test setup. Label the origin clearly and compare the construction and conditions with the intended PCB. Do not present simulation output as a manufacturing test certificate.
For a Best Technology RF PCB enquiry, send the stackup, conductor requirements, model boundary and intended validation scope to sales@bestpcbs.com. Keep the supplied network file paired with its physical port map and construction revision.