

S/N ratio (Signal-to-Noise Ratio, or SNR) measures the strength of a useful signal relative to background noise, usually expressed in decibels (dB). For example, 20 dB means signal power is 100 times noise power, while 30 dB represents a ratio of 1,000:1.
But is 30 dB good enough for your equipment? Why can two devices with similar SNR specifications perform differently, and how can you tell whether a low reading comes from the circuit or the measurement setup? Understanding how SNR is measured and interpreted helps you answer these questions, compare equipment specifications, and identify signal-quality problems.
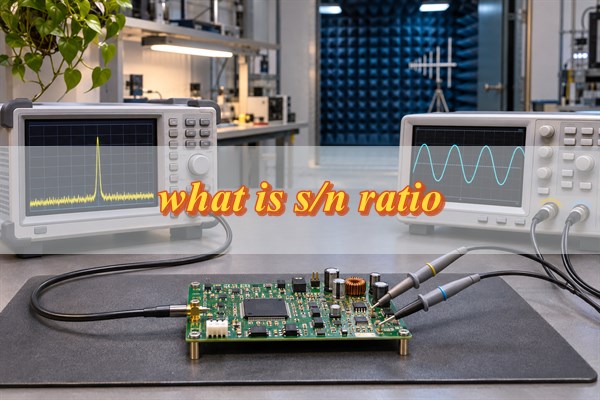
What Is S/N Ratio and What Does It Reveal About Signal Quality?
S/N ratio describes how much stronger a desired signal is than the noise measured alongside it. It is widely used in audio systems, wireless receivers, sensors, amplifiers, and electronic measurement equipment.
When the signal is much stronger than the noise, small signal changes are generally easier to distinguish. As the relative noise level increases, detecting or processing useful information becomes more difficult.
However, signal strength alone does not determine SNR.
Consider two hypothetical wireless receivers measured over the same bandwidth:
- Receiver A: Signal power of −50 dBm and noise power of −55 dBm, giving an SNR of 5 dB.
- Receiver B: Signal power of −80 dBm and noise power of −100 dBm, giving an SNR of 20 dB.
Receiver A has a stronger signal, but its signal-to-noise power ratio is only about 3.16:1. Receiver B receives a weaker signal, yet its signal power is 100 times its noise power.
Receiver B therefore has better signal separation relative to noise. Whether it can decode information more reliably also depends on receiver sensitivity, modulation, coding, and other operating conditions.
SNR measures signal separation from noise, not overall signal quality. Distortion, timing errors, and other limitations must be evaluated separately.
How Do You Calculate S/N Ratio Using Power, Voltage, or dBm?
S/N ratio is calculated by comparing signal power with noise power. Three calculation methods are commonly used, depending on the available measurement data.
- Power measurements: SNR (dB) = 10 × log10(Psignal / Pnoise). Use this formula when the signal and noise are expressed as comparable power values.
- RMS voltage measurements: SNR (dB) = 20 × log10(Vsignal / Vnoise). This applies when both RMS voltages are measured across the same impedance.
- dBm measurements: SNR (dB) = Signal power (dBm) − Noise power (dBm). Both readings must represent comparable total power measurements.
For a power-based example, suppose a circuit produces 5 mW of useful signal power and 0.05 mW of noise power.
SNR = 10 × log10(5 / 0.05)
SNR = 20 dB
The useful signal power is 100 times the noise power.
For a separate voltage-based example, suppose the measured signal is 100 mV RMS and the noise is 1 mV RMS across the same impedance.
SNR = 20 × log10(100 / 1)
SNR = 40 dB
The RMS voltage ratio is 100:1, corresponding to a power ratio of 10,000:1 under equal-impedance conditions.
Be careful when working with logarithmic units. dB expresses a ratio, dBm represents absolute power, and dBm/Hz represents power spectral density. A noise-density value must be integrated over the relevant bandwidth before comparison with total signal power.
How Do You Measure S/N Ratio Step by Step?
Accurate SNR measurement requires a defined test signal, an appropriate instrument, and a consistent method for separating signal power from noise power. The procedure depends on whether you are measuring an analog amplifier, RF receiver, sensor, or sampled signal.
Spectrum analyzers are commonly used for frequency-domain measurements. Oscilloscopes help examine waveforms, while audio analyzers and data acquisition systems can provide more suitable measurements for particular applications.
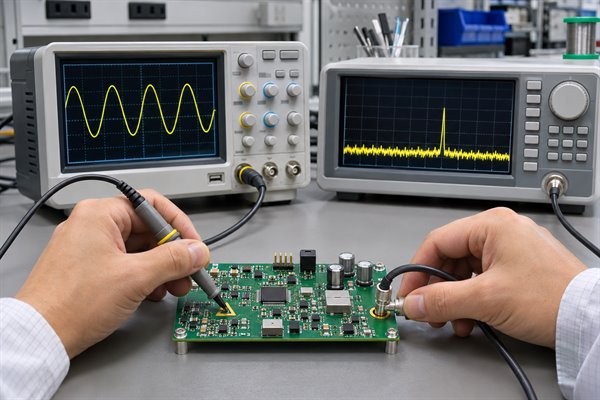
For a practical example, consider measuring the SNR of an analog audio amplifier using a 1 kHz test signal.
-
Apply a known test signal. Feed a clean 1 kHz sine wave into the amplifier. Set the input level, gain, output load, and supply conditions to the values required by the test.
-
Measure the output signal. Use a suitable analyzer to measure the fundamental output signal. Suppose the measured output is 1 V RMS. Confirm that the amplifier is not clipping and that the instrument can measure the signal accurately.
-
Measure the noise. Use spectral analysis to determine the integrated noise over a specified bandwidth, such as 20 Hz–20 kHz. Exclude the fundamental signal and, for a conventional SNR measurement, the harmonic distortion components. Suppose the integrated RMS noise is 1 mV.
-
Calculate SNR. Because both RMS values refer to the same output impedance, apply the voltage-based formula:
SNR = 20 × log10(1 / 0.001)
SNR = 60 dB
-
Verify the measurement. Repeat the test without changing the operating conditions. Record the output load, bandwidth, reference signal, instrument settings, and noise calculation method.
This is an illustrative calculation, not a measurement from a particular amplifier. The result means the RMS signal amplitude is 1,000 times the RMS noise amplitude under the stated conditions.
The most important part of measuring SNR is obtaining trustworthy signal and noise values. If instrument noise is significant, or the signal and noise are measured under incompatible conditions, even a mathematically correct calculation can be misleading.
For RF systems, the same principle applies, but signal and integrated noise power are often measured in dBm rather than RMS voltage. The test method must account for the receiver’s operating state, signal bandwidth, and instrument characteristics.
What Do Different S/N Ratio Measurements Mean in dB?
SNR values in dB describe the logarithmic relationship between signal power and noise power. The following chart shows how common readings correspond to power and RMS voltage ratios.
| SNR (dB) | Power Ratio | RMS Voltage Ratio |
|---|---|---|
| −10 | 0.1:1 | 0.316:1 |
| 0 | 1:1 | 1:1 |
| 10 | 10:1 | 3.16:1 |
| 20 | 100:1 | 10:1 |
| 30 | 1,000:1 | 31.62:1 |
| 40 | 10,000:1 | 100:1 |
| 60 | 1,000,000:1 | 1,000:1 |
Note: RMS voltage ratios apply to equal-impedance measurements.
What Is a Good S/N Ratio for Different Electronic Applications?
A good S/N ratio is one that meets the performance requirements of the equipment being evaluated. There is no universal SNR threshold that guarantees acceptable performance across every electronic application.
The appropriate value depends on what the system must detect, reproduce, or transmit.
-
Audio equipment: Higher SNR generally indicates less background noise relative to a defined audio signal. However, comparisons require equivalent reference levels, measurement bandwidths, and weighting methods. Distortion and frequency response also affect audio performance.
-
Wireless communication: The required SNR depends on modulation, coding, receiver performance, and the target data rate. A robust low-rate transmission mode may operate at an SNR that would not support a faster transmission mode.
-
Sensor systems: SNR affects the ability to distinguish small changes in the measured quantity. A precision sensor intended to detect weak signals may require greater signal separation than a sensor measuring relatively large changes.
-
Analog-to-digital converters: For an ideal N-bit ADC with a full-scale sine-wave input and quantization noise evaluated over the Nyquist bandwidth, theoretical SNR is approximately 6.02 × N + 1.76 dB. Under these assumptions, an ideal 12-bit ADC has a theoretical SNR of approximately 74 dB.
Consider a sensor designed to detect a 1 mV RMS signal change. If the relevant RMS noise is 100 µV, the signal-change-to-noise ratio is 20 dB. Reducing the noise to 10 µV increases that ratio to 40 dB.
Whether either condition is acceptable depends on the required detection confidence, signal processing method, and other sources of measurement error.
When evaluating an SNR specification, compare it with the system’s actual performance requirement, rather than relying on generic Good or Excellent ratings.
Why Does Measurement Bandwidth Change the Reported S/N Ratio?
Measurement bandwidth affects how much noise is included in an SNR calculation. When signal power remains constant and the noise power spectral density is flat, increasing the measurement bandwidth raises integrated noise power and reduces the reported SNR.
For white noise:
Total noise power = Noise power spectral density × Effective noise bandwidth
When noise density is expressed in dBm/Hz:
Noise power (dBm) = Noise density (dBm/Hz) + 10 × log10(Bandwidth in Hz)
Consider a hypothetical signal with a fixed power of −70 dBm and a constant noise density of −140 dBm/Hz.
- At 10 kHz bandwidth: Integrated noise power is −100 dBm, resulting in an SNR of 30 dB.
- At 100 kHz bandwidth: Integrated noise power is −90 dBm, resulting in an SNR of 20 dB.
The wider bandwidth includes ten times as much noise power. Although the desired signal power remains unchanged, SNR decreases by 10 dB.
Under the same assumptions, doubling the effective noise bandwidth increases integrated noise power by approximately 3 dB.
This explains why two measurements taken over different bandwidths can report different SNR values for the same circuit.
However, a narrower bandwidth does not automatically produce a more accurate measurement. If filtering removes part of the useful signal or excludes noise relevant to system operation, the result may no longer describe actual performance.
For valid comparisons, use the bandwidth specified by the application or test standard.
Why Can the Same Circuit Produce Different S/N Ratio Readings?
The same circuit can produce different SNR readings when its signal level, gain, temperature, or operating conditions change. A lower reading does not necessarily indicate a circuit defect.
Several factors can explain the difference:
-
Input signal level: If the useful signal power decreases by 6 dB while noise power remains constant, SNR also falls by 6 dB. This can happen even when the circuit is functioning normally.
-
Amplifier gain: Increasing gain can raise both the signal and existing noise. Noise generated by individual amplifier stages may also contribute differently at different gain settings.
-
Temperature: Temperature changes can influence component noise and other electrical characteristics, particularly in sensitive analog circuits.
-
Power supply conditions: Supply disturbances may introduce unwanted signal components or change circuit behavior.
-
Operating state: Automatic gain control, power-saving modes, and changes in signal processing can alter measured SNR.
For example, a sensor tested with a weaker input signal may show lower SNR even if its internal noise remains nearly unchanged. The result reflects the new signal condition rather than a deterioration in the hardware.
Before comparing readings, confirm that the relevant operating conditions have remained consistent. A reliable comparison requires a reproducible test procedure, not merely the same circuit or measuring instrument.
How Do You Compare S/N Ratio Specifications Across Devices?
Two SNR specifications are directly comparable only when their measurement definitions and operating conditions are sufficiently consistent. A higher published SNR does not automatically mean better practical performance.
Consider two hypothetical audio converters:
| Specification | Device A | Device B |
|---|---|---|
| Published SNR | 96 dB | 92 dB |
| Reference Signal | 2 V RMS | 1 V RMS |
| Measurement Bandwidth | 20 Hz–20 kHz | 20 Hz–20 kHz |
| Weighting | A-weighted | Unweighted |
| Gain | Unity | Unity |
Do not select Device A simply because its published SNR is 4 dB higher. The values use different reference amplitudes and noise-weighting methods, so they do not establish which converter has better noise performance under the same conditions.
A meaningful comparison requires the following:
- Reference signal: Use the same reference signal level or normalize the measurements using sufficient technical information.
- Measurement bandwidth: Compare noise integrated over the same relevant frequency range.
- Weighting method: Compare A-weighted values with A-weighted values, or unweighted values with equivalent unweighted measurements.
- Operating conditions: Check gain, supply voltage, input frequency, output load, and other specified settings.
- Specification limits: Distinguish typical SNR values from guaranteed minimum performance.
For example, request measurements of both converters at a 1 V RMS reference level, 20 Hz–20 kHz bandwidth, unweighted noise measurement, and equivalent gain and load conditions, provided these conditions fall within both devices’ valid operating ranges.
If Device A then measures 96 dB and Device B measures 92 dB under those same conditions, Device A has a 4 dB SNR advantage in that test. This corresponds to approximately 2.51 times the signal-to-noise power ratio.
However, those standardized results must actually be measured or supported by equivalent specifications. The original published figures alone cannot establish that advantage.
For equipment selection, compare SNR under conditions that represent the intended application, then consider distortion, dynamic range, and other relevant performance requirements.
Which Measurement Errors Can Make S/N Ratio Results Unreliable?
SNR measurements become unreliable when the test method introduces errors that are not accounted for. Some errors produce obviously incorrect results, while others create believable numbers that misrepresent the device’s actual noise performance.
The most common problems include:
-
Mixing voltage definitions: Comparing a peak signal voltage with an RMS noise voltage produces an incorrect amplitude ratio. Convert both values to compatible RMS measurements.
-
Incorrect FFT analysis: Spectral leakage, unsuitable windowing, or improper frequency-bin integration can cause signal energy to appear as noise.
-
Instrument noise contamination: When the instrument’s own noise approaches the noise level of the device under test, its contribution can significantly increase the measured noise power.
-
Incorrect noise integration: A single spectrum-analyzer noise-floor reading does not necessarily represent total noise power over the required bandwidth.
-
Including distortion components: Harmonic distortion and random noise represent different performance limitations. Including distortion changes the measurement definition and may produce a result closer to SINAD than SNR.
Instrument noise is particularly important when testing low-noise circuits.
Suppose a device generates noise power of −100 dBm, while the measurement system contributes independent noise power of −103 dBm over the same bandwidth.
Because independent noise powers add on a linear scale, the instrument measures a combined noise level of approximately −98.2 dBm rather than the device’s actual −100 dBm.
With the signal power unchanged, the reported SNR would be approximately 1.8 dB lower than the device’s actual SNR.
This difference can affect comparisons between devices with similar specifications.
For reliable measurements, confirm that the instrument has adequate sensitivity and dynamic range, and that the noise measurement method matches the intended SNR definition.
What Does a Low S/N Ratio Reveal, and How Do You Troubleshoot It?
A low S/N ratio means the useful signal has insufficient separation from noise for the required performance target. Before changing the circuit, determine whether the signal has weakened, the noise has increased, or the measurement setup has changed.
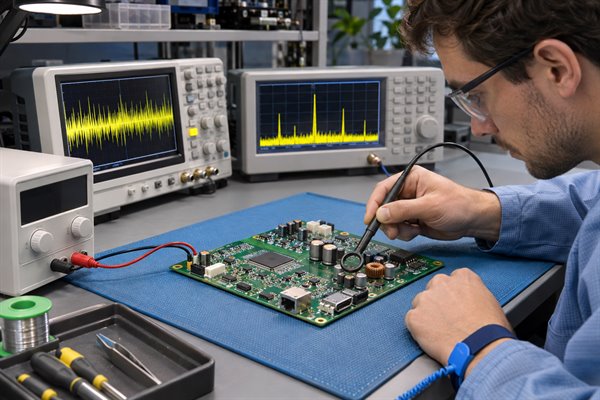
A baseline measurement is the most useful starting point.
Suppose a receiver initially measures:
- Signal power: −70 dBm
- Noise power: −95 dBm
- SNR: 25 dB
During a later test, signal power remains at −70 dBm, but measured noise increases to −85 dBm. The SNR falls to 15 dB.
Because the signal power is unchanged, the investigation should focus on the increased measured noise.
A practical troubleshooting sequence is:
-
Check the signal path. If signal power has decreased, inspect the source level, cables, connectors, terminations, and amplifier settings. Measure at successive points to locate unexpected attenuation.
-
Examine the noise spectrum. Determine whether the additional unwanted energy is broadband or concentrated at particular frequencies. Periodic interference may require separate evaluation from random noise.
-
Compare operating conditions. Check temperature, supply voltage, gain, and other relevant settings against the original measurement.
-
Verify the suspected cause. Change one relevant condition at a time and repeat the measurement. Look for a measurable, reproducible change rather than relying on assumptions.
For example, if unwanted spectral components appear near a switching regulator’s operating frequency, compare their amplitudes under controlled operating conditions. This can help establish whether the power supply contributes to the problem.
Avoid adding filters, replacing components, or changing PCB layouts before confirming the source. A filter may reduce unwanted noise but also attenuate part of the desired signal.
Effective troubleshooting identifies the source of degradation and verifies that the correction improves the relevant signal-quality requirement.
FAQs About S/N Ratio
Q1: What Is the Difference Between SNR and SINAD?
A1: SNR compares the desired signal with noise, while SINAD includes both noise and distortion. This distinction matters when evaluating ADCs, amplifiers, and other devices where harmonic distortion affects signal fidelity. A device may have relatively low random noise but still produce significant distortion, resulting in SINAD lower than its SNR.
Q2: Is SNR the Same as Dynamic Range?
A2: No. SNR measures signal power relative to noise power, while dynamic range describes the span between an upper signal limit and a lower usable signal level under a defined specification. The two quantities can be related, especially in data converters, but their reference levels and measurement methods may differ. They should not be treated as interchangeable without checking the manufacturer’s definitions.
Q3: Can Digital Averaging Improve SNR?
A3: Yes. Digital averaging reduces sufficiently random, uncorrelated noise when the useful signal remains stable. Averaging 100 independent measurements can theoretically improve the applicable SNR by approximately 20 dB. However, averaging may reduce measurement speed and does not necessarily remove drift, periodic interference, or systematic errors. Its effectiveness depends on the noise characteristics and the behavior of the measured signal.
Q4: What Is the Difference Between SNR and Carrier-to-Noise Ratio?
A4: Carrier-to-noise ratio, or C/N, compares carrier power with noise power over a defined bandwidth. SNR is a broader measurement comparing useful signal power with noise. The two quantities may be closely related in communication systems, but their definitions depend on the signal type and test procedure. They should not be assumed equivalent without checking the relevant measurement conditions.
Q5: What Does dBFS Mean in ADC Specifications?
A5: dBFS means decibels relative to full scale, the maximum defined digital signal level. It is commonly used in ADC and digital audio measurements to express signal or noise levels relative to that reference. SNR, by contrast, is a signal-to-noise ratio expressed in dB. Interpreting a noise-floor value in dBFS requires understanding the reference signal and measurement bandwidth.
Q6: Does Oversampling Automatically Improve SNR?
A6: No. Oversampling can improve in-band SNR when combined with appropriate filtering that removes out-of-band noise. For approximately white quantization noise, increasing the sampling rate spreads noise power over a wider frequency range. The benefit comes from the resulting reduction in in-band noise, not from a higher sampling rate alone. Oversampling and digital averaging are different techniques, although both can improve measurement performance under suitable conditions.
Q7: What Is the Relationship Between SNR and Bit Error Rate?
A7: SNR affects how reliably a receiver distinguishes transmitted information from noise, while bit error rate (BER) measures the proportion of received bits that are incorrect. Under comparable conditions, increasing SNR generally reduces error probability. However, the relationship depends on modulation, coding, interference, and receiver processing. There is no universal conversion between SNR and BER for all communication systems.
Q8: How Is SNR Different From Noise Figure?
A8: SNR compares signal power with noise power at a specified measurement point. Noise figure describes how much a device or signal chain degrades SNR between its input and output under defined conditions. It is particularly useful when evaluating RF amplifiers and receivers. A lower noise figure generally indicates less SNR degradation, but it does not independently determine the final output SNR.
Q9: Can You Measure SNR Without a Known Test Signal?
A9: Sometimes, but the measurement requires a reliable way to distinguish useful signal energy from noise. For example, a receiver may estimate SNR using known pilot symbols embedded in a transmitted signal. In some analog systems, noise can be measured during a controlled signal-free interval if operating conditions remain unchanged. Without a valid signal reference or separation method, an arbitrary waveform cannot always be divided reliably into signal and noise components.
Q10: How Is Signal-to-Interference Ratio Different From SNR?
A10: Signal-to-interference ratio (SIR) compares desired signal power with unwanted interference power, such as energy from another transmitter. SNR compares signal power with noise power. When both interference and noise affect communication performance, SINR (Signal-to-Interference-plus-Noise Ratio) is often the more appropriate metric. The correct measurement depends on whether random noise, interference, or both limit the system.
Understanding what S/N ratio means is essential for evaluating signal quality, but a dB value becomes meaningful only when its measurement conditions are clear. Accurate signal and noise measurements, the correct bandwidth, and consistent operating conditions allow you to compare devices and identify signal-quality problems.
Are you preparing a PCB or PCBA project for a noise-sensitive electronic system? EBest Circuit provides custom PCB fabrication, SMT assembly, inspection, and customer-defined electrical testing based on approved project specifications. Send your Gerber files, BOM, quantity, required delivery date, delivery location, and testing requirements to sales@bestpcbs.com for a free DFM check and project-specific quotation. Our team can review manufacturability and the proposed assembly and testing scope, helping you confirm production requirements before placing an order.