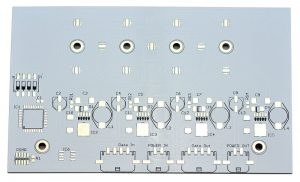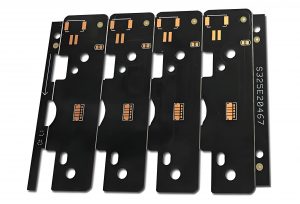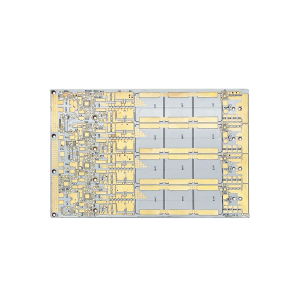


Metal core PCB capacitance forms where copper overlaps the conductive base across an insulating layer. To estimate one path, use the copper area for the net you care about, the finished dielectric thickness and the material’s relative permittivity (Dk). To check the estimate, measure between that net and the base on a bare board or representative coupon using a compensated LCR fixture.
Start with an aluminum-backed power board. We’ll calculate its copper-to-base capacitance, compare two real dielectrics of the same thickness, and show how to tell a fixture error from a real difference. If the board passes insulation testing but still couples noise into the housing, the last sections show how to narrow down that path. The worked numbers are estimates, not measurements or product ratings.
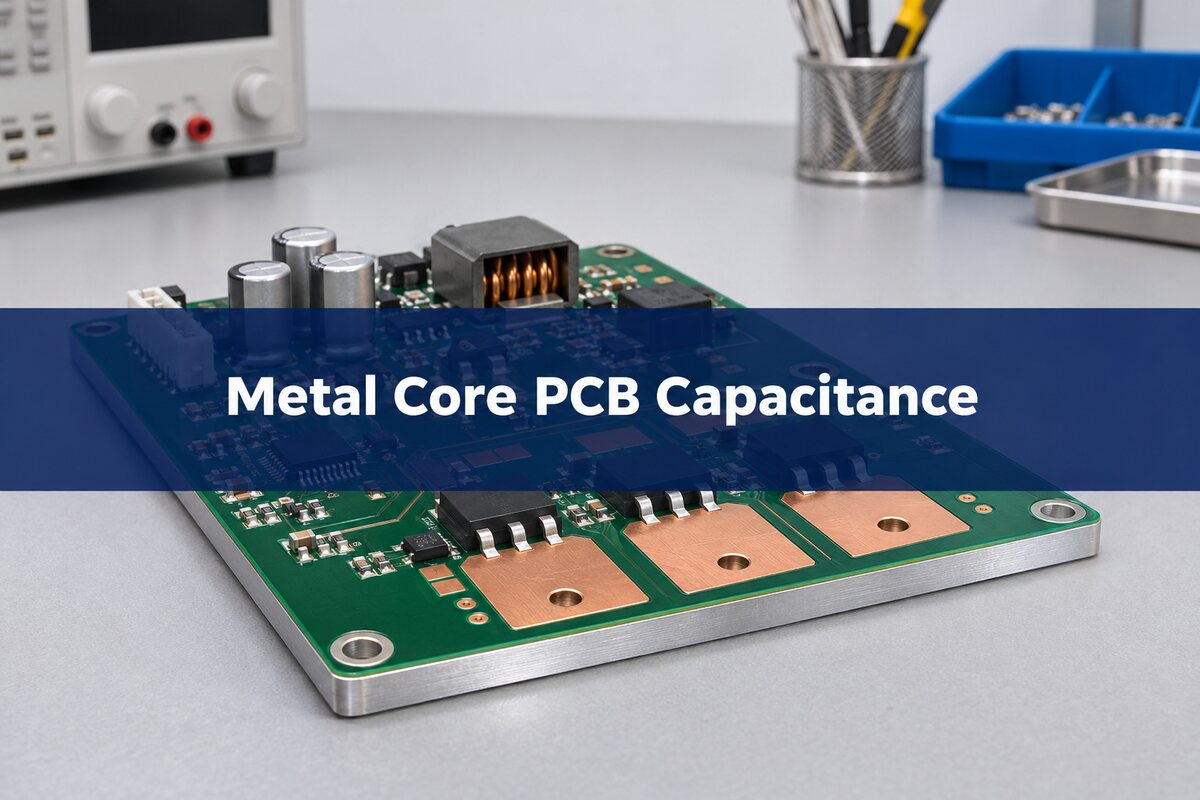
Metal Core PCB Stackup: Find the Two Conductive Surfaces
On a typical single-layer insulated metal substrate, the top copper carries the circuit. A thin insulating layer separates it from the aluminum base. Look at the fabrication cross-section and highlight the part of the copper tied to the switch node. The overlap of that copper and the metal base is the first area to estimate. Using the whole board area can badly overstate that particular path.
Then mark what the base touches: a conductive housing, an isolated mounting interface or neither. The base is not automatically circuit ground. The path can continue through hardware, the enclosure, a cable or nearby conductors. An electrically floating plate can still couple to its surroundings. The Henkel Thermal Clad selection guide describes the insulation and thermal roles of the laminate. Verify the proposed build rather than assuming every MCPCB has the same stack.
Parasitic Capacitance in PCB: Insulated Is Not the Same as Uncoupled
DC isolation means the two conductors are separated under the specified conditions. Capacitance means that changing the voltage between them moves charge on the conductors. A fast edge can drive current through that capacitive path even if the insulation is intact. IPC-TM-650 Method 2.5.7, Revision D (May 2004), §1 describes a PCB dielectric-withstand method, not an emissions test or a per-board capacitance limit.
The capacitance is spread over the copper pattern. A switch node, a quiet ground pour and an output pad can all face the same base and carry different waveforms. Estimate each relevant net separately rather than treating every copper region as a single switching electrode. A meter reading across a whole assembled board may combine paths the one-net model deliberately leaves out.
Parallel Plate Capacitor Formula: Estimate the Board-to-Base Path
For an initial estimate, use C ≈ ε₀ × εr × A / d. Here ε₀ is 8.854 × 10⁻¹² F/m, εr is the dielectric’s relative permittivity, A is the overlap area in m², and d is the separation in metres. This uniform parallel-plate model ignores fringing, mounting and package paths. Use it when the overlap dimensions are large compared with the separation. The OpenStax capacitance equations give the underlying model.
| Input | Example | Where to get it |
| Copper overlap | 10 cm² | Use the specified net over the base, not the board outline. |
| Dielectric thickness | 100 µm | Use the finished insulation thickness, not the metal thickness. |
| Relative permittivity | 6 assumed | Use supplier data at a relevant frequency when available. |
| Slew across dielectric | 20 V/µs assumed | Use the voltage change between the two conductors. |
Convert 10 cm² to 0.001 m² and 100 µm to 0.0001 m. Then 8.854 × 10−12 × 6 × 0.001 / 0.0001 = 5.3124 × 10⁻¹⁰ F, or about 531 pF. For quick estimates using cm² and µm, use C (pF) ≈ 885.4 × Dk × A (cm²) / d (µm). Replace the example inputs with your net area and finished stackup; compare the unrounded result before rounding for display.
Dielectric Constant vs Thermal Conductivity: Compare Two Real Materials
Two insulating layers can have the same nominal thickness and very different electrical and thermal behavior. The Bergquist data sheets below show why a drawing that says only “76 µm dielectric” is not enough to approve a substitution.
| Published typical property | HT-04503 | MP-06503 |
| Dielectric thickness | 76 µm | 76 µm |
| Relative permittivity (Dk) | 7 | 6 |
| Capacitance density | 85 pF/cm² | 65 pF/cm² |
| Dielectric thermal conductivity | 2.2 W/(m·K) | 1.3 W/(m·K) |
| Df at 1 MHz | 0.0148 | 0.017 |
Sources: Bergquist HT-04503, typical values, page 1 and Bergquist MP-06503, March 2019, page 1. The sheets cite ASTM D150 for electrical values and ASTM D5470 for dielectric thermal conductivity. The capacitance-density rows do not separately state a frequency; do not assign them the 1 MHz condition shown for Df. Compare dielectric conductivity with dielectric conductivity, not with the separately listed conductivity of the whole product.
Multiplying the listed densities by the same 10 cm² gives roughly 850 pF for HT and 650 pF for MP, before geometry effects. That is a separate data-sheet projection for 76 µm materials, not the 531 pF calculation for the hypothetical 100 µm stack. MP has the lower listed capacitance density; HT has the higher listed dielectric conductivity. If both temperature and noise margins are tight, confirm the current material revision and use a coupon and the intended assembly to check the proposed substitution. These typical values do not establish availability or lot acceptance limits.
Dielectric Thickness and Capacitance: Check the Thermal Cost
At a fixed 10 cm² overlap and Dk of 6, increasing the dielectric from 75 to 150 µm cuts ideal capacitance from about 708 to 354 pF. If the effective heat-flow area is also 10 cm² and the dielectric conductivity is 2 W/(m·K), Rth = d/(kA) gives 0.0375 and 0.075 K/W for that layer, respectively. These are one-dimensional estimates. In real assemblies, heat-flow area and electrical overlap need not match; package, solder, spreading and the mounting interface are not included.

| Ideal example at Dk = 6 | Capacitance | Layer thermal resistance |
| 75 µm, 10 cm² | 708 pF | 0.0375 K/W |
| 150 µm, 10 cm² | 354 pF | 0.075 K/W |
If only one switching net causes concern, try reducing that net’s overlap before changing the laminate everywhere. Cutting the 100 µm reference example from 10 to 5 cm² lowers the estimate from 531 to 266 pF. Check copper temperature, current density and loop geometry before accepting the smaller area. If you change the dielectric, confirm both thermal and insulation evidence; use the separate metal core PCB isolation evidence guide for the withstand report.
Metal Core PCB vs FR4: Which Coupling Path Changes?
| Construction | Likely path to examine | Design trade-off |
| Metal core PCB | Switching copper to the metal base, then through the mechanical assembly. | Built-in heat spreading; check how the base relates to the enclosure. |
| FR-4 PCB | Switching copper to nearby copper planes and, where present, an external heatsink or chassis. | More choices for plane placement; still check the heat path and stray coupling. |
Neither construction is inherently quieter. Compare the same circuit and mounting conditions. If the metal base is doing work your thermal design needs, check geometry and return paths before replacing the board material. For controlled-impedance or high-frequency work, use a stackup-specific model instead of guessing from the nominal board type.
LCR Meter Capacitance Measurement: Copper Net to Metal Base
Measure on an unpowered, disconnected and discharged sample. Use a bare board or coupon if you need the laminate path alone. Connect the fixture between a defined copper electrode and a documented bare-metal contact on the base. Record how other conductors are left floating, guarded or connected; changing that configuration changes what the reading represents. Do not assume an oxidized or coated mounting point makes a reliable metal contact.
- Choose the instrument and conditions. Use a fixture and meter range suited to the expected capacitance. Select and record the test frequency, AC test level, bias if used, temperature and equivalent mode. A parallel capacitance reading (Cp) is often useful for a low-capacitance, high-impedance specimen; use the instrument’s guidance and match the comparison method.
- Compensate at the sample connection. Follow the meter and fixture instructions for open and short compensation; add load compensation only where appropriate. Do this with the same lead routing, contact geometry and frequency used for the sample. If the fixture changes, repeat compensation. See Keysight’s Impedance Measurement Handbook, §§4.3.2–4.3.3 and HIOKI’s guide to LCR modes and compensation.
- Measure and reconnect. Save the sample ID, electrode dimensions, reported capacitance and equivalent mode. Record dissipation factor or phase if useful to diagnosis. Remove and reconnect the sample to see whether the result is stable. When frequency dependence matters, repeat at the agreed frequencies without silently changing the other settings.
If the reading moves when the fixture or contacts move, check the open residual and contact repeatability first. If the reading stays high, verify the finished thickness and Dk basis, then check for neighboring electrodes, attached circuitry and parallel paths. A bare coupon can isolate the construction better than a populated board, but it does not establish the assembled system’s noise performance.
For acceptance, ask for the drawing revision, electrode and base contacts, fixture compensation, conditions, readings and the agreed limit or reference. A report that only says “PASS” or lists a capacitance with no frequency cannot establish that your design requirement was met. If no purchase limit exists, compare to the calculated range and investigate a mismatch; do not turn the 531 pF estimate into a universal pass value.
Capacitive Reactance: When the Coupling Starts to Matter
The ideal reactance magnitude is 1/(2πfC). At 1 MHz, the hypothetical 531 pF path is about 300 Ω; at 10 MHz it is about 30 Ω, if capacitance is treated as constant and inductance and loss are neglected. That makes the path worth checking at high frequencies, but it does not predict the current in a specific cable. The connected return path is part of the circuit.
For the same example, i = C × dV/dt. With about 531 pF and 20 V/µs across the dielectric, the ideal edge current is about 10.6 mA. Use the voltage between the net and the base, which may differ from the net-to-circuit-ground waveform. This current is instantaneous, not average leakage or an EMI result. TI’s note on parasitic capacitance explains the relationship, and its single-layer aluminum PCB analysis discusses additional noise mechanisms on this type of board.
Switch Node Ringing: Separate Edge Slew From Overshoot
Slew describes how steeply the voltage moves during an edge; ringing is the oscillation that can follow. They affect different parts of the noise spectrum. Compare the actual switch waveform against a repeatable cable-current or emissions observation before blaming either one. Changing copper geometry can alter the commutation loop as well as capacitance, so a change in emissions by itself doesn’t identify which effect dominated.
Check the waveform with a suitable rated measurement setup and a short, appropriate connection. A long probe return or probe capacitance can change what you see. Keep the probe configuration and load the same across comparisons. The Analog Devices layout note AN-136 explains why the switching copper area matters. Don’t remove copper needed for a reliable thermal path or a low-inductance power loop without verifying the result.
Common Mode Current Path: Follow the Return Through the Housing
Draw the loop on the assembly, not just the PCB. Start at the switch node, cross the dielectric capacitance to the metal base, follow the path through the housing or nearby conductors, and mark how current can return to the converter. The dominant path depends on mounting, cables, enclosure and filter placement. Changing the housing contact can change both the noise path and the cooling path.
For a controlled comparison, keep the mounting and cable geometry fixed unless they are the variable being investigated. If cable current changes when overlap is reduced and slew is unchanged, the base path is worth investigating further. If it does not change, check measurement repeatability and alternate paths, such as transformer coupling or a connector shield. Do not disconnect required protective bonding or defeat insulation to run a comparison.
Common Mode vs Differential Mode Noise: Pick the Right Check
On a two-wire feed, differential current leaves on one wire and returns on the other. Common-mode current on the two wires flows in the same direction relative to an external reference and returns elsewhere. A current probe around both feed conductors together can help detect their net high-frequency current, subject to probe bandwidth, installation and other return paths. It does not, by itself, identify the source.
| Observation | What it suggests | Next comparison |
| Both-wire probe signal rises at the switch edge | A common-mode path is active. | Compare two build variants with the same edge slew and cable routing. |
| Line-to-line disturbance, little net probe current | A differential path is worth checking. | Review input bypass and loop layout; don’t assume the base is the only path. |
| Scope shows a change, emissions do not | The visible feature may not dominate the limit band. | Compare frequency bands and repeat under the agreed fixture conditions. |
A line-impedance stabilization network (LISN) and a suitable separation setup can help distinguish modes during pre-compliance. Analog Devices’ EMI filter design note shows separate current paths. A bench comparison guides diagnosis; final limits and methods come from the applicable product and market test plan.
Common Mode Noise Measurement: Verify the Change Before Release
Record the board and stack revision, enclosure and mounting, supply and load, cable configuration, operating mode, measurement bandwidth and baseline trace. Select a comparison tied to one hypothesis: for example, reduce overlap without changing the dielectric or mounting. Recheck the waveform, net cable current and temperatures at the same operating points. If you changed two variables, a quieter result is useful, but you cannot credit it to one of them.

For release, ask for emissions data at the agreed product conditions and thermal or isolation evidence for the approved build. An example result marked “peak down” without units, frequency, configuration or a limit is not enough to sign off. Keep the diagnosis and the compliance decision separate. For mains or high-energy hardware use a qualified lab and approved procedures.
Metal Core PCB Capacitance FAQs
Can an MCPCB pass hipot and still have high capacitance?
Yes. Hipot checks withstand under specified conditions. Capacitance describes how charge changes with voltage; the two results answer different questions.
Is 531 pF a normal value for every aluminum PCB?
No. It’s the ideal estimate for 10 cm² overlap, 100 µm of insulation and an assumed Dk of 6. Use your proposed construction and geometry.
Is a floating metal base always quieter?
No. It can still couple to an enclosure or cable. Keep required safety connections intact and verify noise in the approved mounting arrangement.
Can I multiply switching frequency by the edge current?
Not to get average leakage or conducted emissions. The pulse width, waveform, repetitions and return impedance matter, and opposing transitions can move charge in opposite directions.
Does copper-base PCB always have more capacitance than aluminum-base PCB?
Not just because of the metal. In the ideal plate model, geometry and dielectric set capacitance, provided both base materials are treated as conductors.
Does a capacitor measurement on the assembled board isolate the laminate path?
Not necessarily. Package, connector and other board paths may appear in parallel. A representative bare sample with a defined electrode and fixture is better for isolating the material path.
Will a common-mode choke fix the problem without a layout change?
It can help on one path, but it won’t remove the underlying coupling or all alternate returns. Verify the band, path, load and real system result.
What changes should trigger an EMI recheck?
Review any change to dielectric, copper overlap, switch slew, mounting contact, enclosure or cable route. These features can affect the path even when the schematic is unchanged.
Technical References
- Texas Instruments: parasitic capacitance and common-mode current
- Analog Devices AN-136: switch-node layout
- OpenStax: capacitance and dielectric equations
Custom Metal Core PCBs with Free DFM Review
Send your files to EBest Circuit for a free design-for-manufacturing (DFM) review of your custom metal core PCB. We can review the proposed construction and flag fabrication questions before you release the order. Request a quote for bare boards, or include assembly requirements if you want the PCB and assembly quoted together.
Request a quote: Email sales@bestpcbs.com with your Gerbers or ODB++ data, stackup or material notes, mechanical drawing and quantities. Include any thermal, isolation or inspection requirements that the quotation needs to cover.