

If a PCB channel model seems to respond before the input, check the reference plane, measured band and frequency step before repairing the file. A real transmission response cannot precede its excitation, but a finite-band plot can show small oscillations around a valid arrival. A late echo can also fold into negative time on a centred display. Change one setting at a time and confirm the result on an independent reference before deciding the model is noncausal.
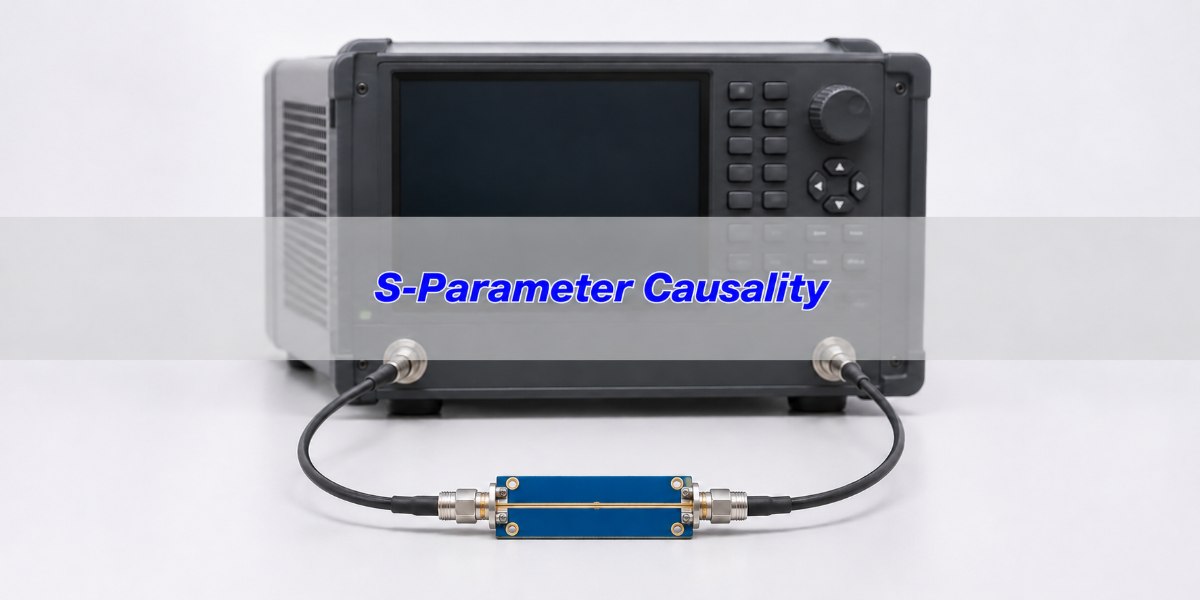
What Is S-Parameter Causality?
A causal network does not respond to a future input. For a correctly referenced linear time-invariant model, the physical impulse response is zero before the excitation at the input reference plane. For a transmission path a known physical delay can give a more specific expected onset, although estimating it requires the actual path, propagation model and reference planes. A reflection at the calibrated input plane can legitimately begin near zero.
Passivity and reciprocity test different properties. The S-parameter passivity check examines whether a passive model creates net power, not whether it responds too early. A small negative group delay over a limited band is likewise not, by itself, proof of noncausality. Use the full measurement and modelling context, rather than one plot attribute.
S-Parameter Impulse Response: Why a Causal Path Can Show Pre-Ringing
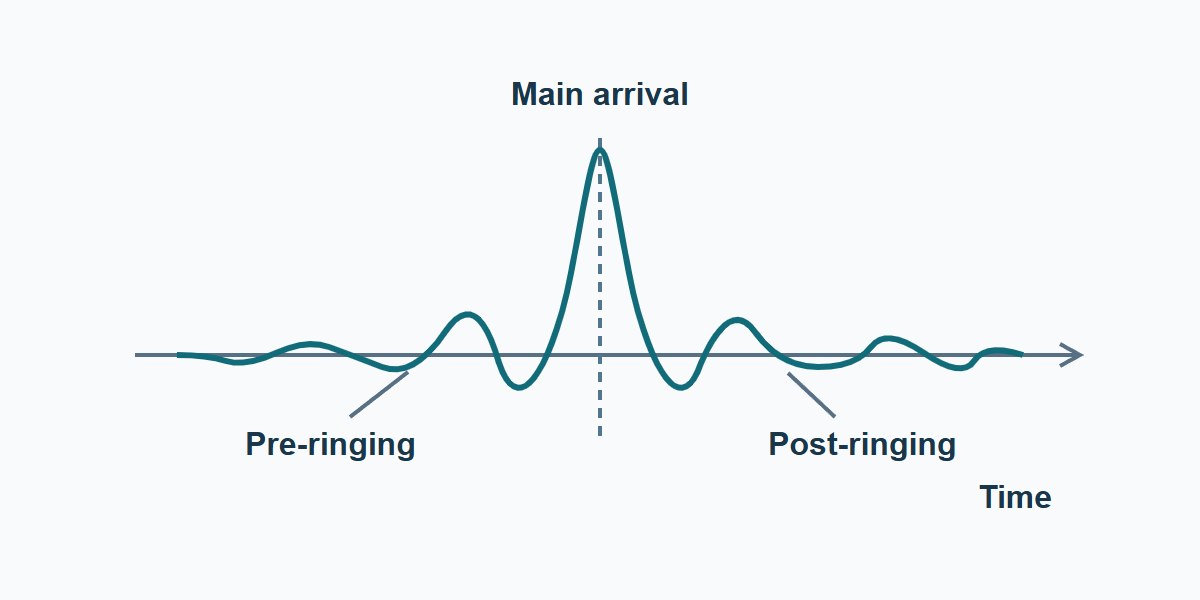
An inverse Fourier transform of a measured sweep works with finite bandwidth. Limiting the spectrum multiplies it by a frequency-domain window; in time this convolves the actual impulse with the window’s time response. A sharp truncation can create sidelobes before and after a causal pulse. A softer window often suppresses sidelobes but broadens the main pulse, so nearby features become harder to separate.
Keep the time origin and original data fixed. Compare the early response with a known line or thru using the same processing and record how it changes under reasonable windows and measured spans. Small features near the main arrival that vary as expected with the window are consistent with truncation. Do not call them real PCB events or declare the file good solely because one strong window hides them.
Frequency Step Size: A Late Echo Can Appear at Negative Time
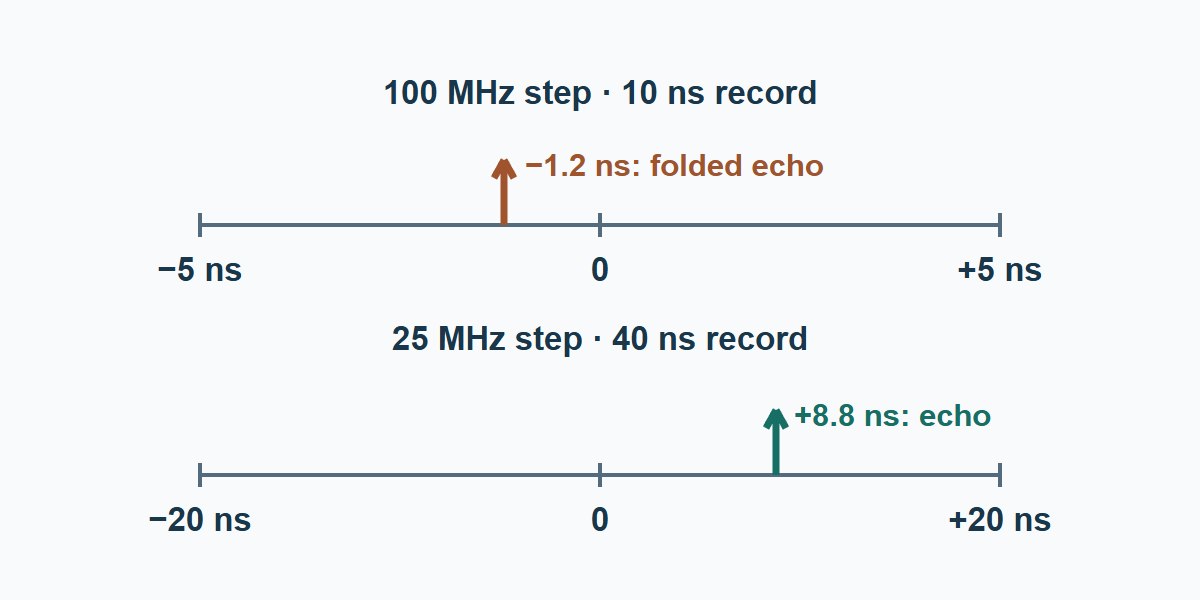
On a uniformly spaced frequency grid, the inverse-transform time record repeats with period T = 1 ÷ Δf. Span and step do different jobs: a larger measured bandwidth can separate closer events, while a smaller frequency step extends the record. Zero-padding or interpolating the same measured samples does not supply independent frequency points or prove that a late event is inside the measured record. If your solver needs a different frequency grid, use this S-parameter interpolation guide to compare Cartesian and polar methods against withheld measured points.
Worked example: assume a delayed echo at +8.8 ns. With a 100 MHz step, T is 10 ns and a centred display covers −5 ns up to +5 ns. The echo appears at 8.8 − 10 = −1.2 ns in that period. Re-measure the same band on a 25 MHz grid and T becomes 40 ns; the centred record goes from −20 ns up to +20 ns and can show the echo at +8.8 ns. These times illustrate ideal periodic mapping, not measured results.
VNA Time Domain: Three Lookalike Faults and Their Checks
Put separate tests around three questions: does the feature track the frequency window, does it move with the record period, or does it first appear during model processing? Perform the changes on a saved copy and verify instrument calibration on the actual sweep grid. Every new data record needs an identifiable setup and reference.
| What you see | Check that separates it | What the result supports |
|---|---|---|
| Small features clustered either side of the main arrival | Compare two reasonable windows and a known line at the same reference planes. | A change in spacing or sidelobe amplitude consistent with the reference supports a finite-band artifact. |
| Isolated early pulse | Re-measure at the same span with a finer frequency step, keeping the setup comparable. | A feature moving by an amount consistent with the repeat period supports a folded response. |
| Entire response moves after port extension or fixture removal | Compare raw and processed stages against a known path and check removed delay and sign. | Hold the processed model until time origin and fixture assignment agree. |
| Early feature persists in a physically implausible location after controlled changes | Compare independent reference measurements and validate the model method and settings. | Do not dismiss it as ringing; isolate the first failing stage and do not release unverified data. |
S-Parameter Reference Plane: Check the Delay You Removed
Keep a sketch from the VNA calibration planes to the DUT planes, with port numbers and the fixture on each side. Compare the untouched sweep with each processed file. On a transmission path a simple delay correction changes phase slope and shifts time. If the applied correction removes more delay than the physical fixture contributes, a correctly measured arrival can appear too early in that processed file.
For example, if an arrival is 1.4 ns from the raw reference and the documented combined fixture delay is 0.6 ns, a delay-only correction would leave about 0.8 ns in this illustrative case. Removing 1.6 ns instead would place it at about −0.2 ns. Real de-embedding can also change amplitude and reflections, so do not treat every fixture as a pure delay. Verify on a reference, and check units and port extensions before editing the DUT model.
If the delay was removed at the instrument, use the VNA port extension guide to check each port’s one-way delay and verify the shifted plane with an independent standard before judging a time-domain arrival.
DC Extrapolation: Use the Physical Low-Frequency Path
A sweep starting above DC does not establish what happens at DC. A through connection with a resistive path and an otherwise isolated series-capacitor path have different low-frequency limits. Use the schematic, DC resistance when relevant, and a suitable low-frequency reference to constrain the extrapolation. Do not assume S21 = 1 or extend the first sample flat for every PCB network.
For a serial interconnect, compare transient results under justified low- and high-frequency continuations, including any actual coupling components. For a DC-blocking filter, use a low-frequency model that preserves the open series path; a convenient flat extrapolation can create a misleading step baseline. In both cases, report which bands were measured and which were estimated. If the outcome changes beyond the project tolerance within plausible assumptions, limit what the model may be used for or remeasure.
Vector Fitting S-Parameters: Compare the Fit With Original Measurements
A well-formed stable, proper rational model with a physically appropriate nonnegative delay can be a useful causal representation. But a fit forces structure on the data. It cannot prove the real PCB matches the result, especially outside the measured band. Do not “fix” a large early pulse by zeroing the response before an arbitrary time; changing the time waveform also changes the frequency response.
For a backplane or cable launch, verify the fit against complex S-parameters, expected delay, and the transient or eye metric used by the system team. For a narrowband RF filter, preserve the wanted passband transmission and phase as well as the stopband range your fixture can establish. For a passive channel, run a separate passivity check on the resulting model and inspect the errors after any enforcement. Reject or limit a fit that meets numerical criteria only by losing a response the application depends on.
S-Parameter Quality Check: What to Sign Off Before Handoff
Use this worksheet when sending a model to a designer or accepting it from a vendor. Fill in the measured band, actual point spacing, reference planes, expected arrival, and the early-time interval used for review. State how acquisition, repeatability and processing affect the decision. There is no universal percentage of pre-arrival energy that applies regardless of bandwidth and window.
| Record | Evidence to include | Action if missing or inconsistent |
|---|---|---|
| Measured sweep and origin | Device and fixture IDs, planes, grid, settings, and reference device trace. | Hold timing comparisons until another engineer can reproduce the origin and band. |
| Early feature example | 100 MHz grid shows −1.2 ns; a qualified 25 MHz remeasurement confirms a corresponding echo at +8.8 ns. | Record the original reading as a display wrap candidate. Confirm the actual echo on the extended record before releasing the original timing claim. |
| Processing and intended use | Window, extrapolation, fixture removal, fit method, residuals and intended application and band. | Do not generalize the fit to unqualified conditions. Refit, remeasure or set limits on use. |
IEEE 370-2020 covers electrical characterization and measured-data quality for printed circuit boards and related interconnects up to 50 GHz. If invoked, apply the agreed method and derived acceptance criteria; the case values above are teaching examples, not IEEE thresholds or PCB workmanship limits.
S-Parameter Causality FAQs
Does every sample before time zero mean a noncausal PCB?
No. Check finite bandwidth, record wrap, reference plane and the measurements before judging the model.
How do I tell ringing from time wrap?
Compare windows on a fixed data set for ringing. Re-measure with a finer frequency step and similar span to test whether an event moves as a folded echo should.
Does a wider span always increase time range?
No. Time-record period is set by frequency step. At fixed point count, a wider span generally increases the step and shortens the record.
Does zero-padding fix missing measurements?
No. It may increase displayed sample density, but does not add information or replace actual low-frequency or finer-grid measurements.
Can a wrong port extension make a response appear early?
Yes. Excess delay removal can shift an arrival too far left. Recheck the fixture map and a known reference before judging the network.
Must the file contain a measured DC sample?
No, but a simulation sensitive to the DC limit needs a physically justified low-frequency continuation and a stated range of validity.
Does a causal fit prove a passive channel model is acceptable?
No. Separately check passivity, complex in-band error, physical delay and performance in the intended circuit.
Should I trim all pre-arrival samples before simulation?
Not as a first step. Find the cause before changing the waveform and verify any processed result against the original complex data.
Technical References
- Keysight: Data Integrity Check — time-domain interpretation and finite bandwidth.
- Keysight: VNA Time Domain — calibration planes, period and alias responses.
- IEEE 370-2020 — official scope and supporting resources.
- MathWorks: Characterize Interconnects Using IEEE 370 — independent quality metrics and example workflow.
- MathWorks: S-Parameters — model fitting and time-domain uses.
Custom High-Speed PCBs With Stackup and Coupon Review
Have a high-speed PCB build that depends on a trustworthy channel model? Send EBest Circuit your layout files, stackup, target impedance, connector or fixture assumptions and the coupon requirements. Request a fabrication quote and stackup review to define the build and verification scope before ordering.