

A power plane and its neighboring ground plane can behave like a resonant cavity. For a uniform rectangular overlap, a first screening estimate uses the electrical length of that overlap: a larger plane or higher dielectric constant moves the first mode lower. Use the estimate to identify a frequency band to investigate, not to predict the exact impedance or emissions of the assembled board.
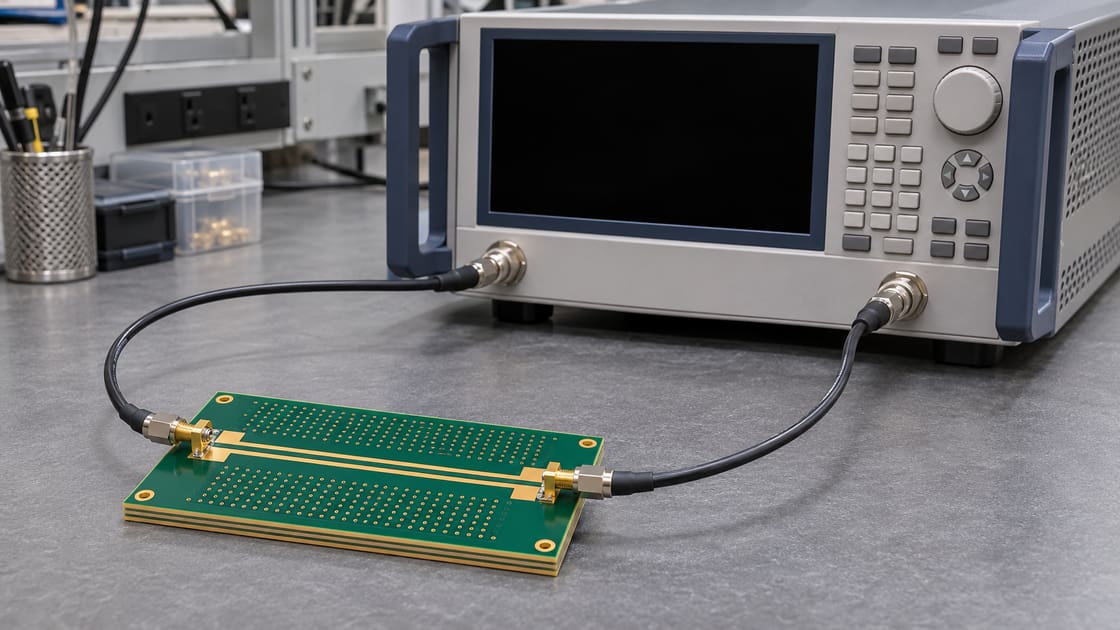
What resonates between the planes
A changing current can launch electromagnetic energy between two copper planes separated by dielectric. At certain frequencies the fields can form standing-wave patterns. A mode is one such pattern; it is not the same as saying that every point on the board has a large voltage at that frequency.
Which rectangle to measure
Use the overlap of the two planes involved, not automatically the finished board outline. A rail that occupies one portion of a larger ground plane has a smaller relevant outline. A narrow neck, cutout or divided rail can invalidate the simple rectangular approximation.
Parameters for a first estimate
Use consistent units and document what each dimension represents.
| Input | Example only | How to use it |
| Overlap length a | 100 mm | Longer in-plane dimension |
| Overlap width b | 60 mm | Shorter in-plane dimension |
| Relative permittivity | 4.0 | Illustrative uniform value for the plane dielectric |
| Plane spacing | Record actual spacing in mm | Influences impedance and coupling; not a term in this simple in-plane frequency estimate |
| Mode indices m and n | (1,0), (0,1) | Number of half-wave variations along each axis under the model |
How to calculate the first two modes
For the idealized rectangular cavity, use f(m,n) ≈ c divided by twice the square root of relative permittivity, multiplied by the square root of [(m/a)² + (n/b)²]. Use meters and c ≈ 3 × 10⁸ m/s. With the sample geometry, (1,0) is about 0.75 GHz and (0,1) about 1.25 GHz. The first nonzero estimate is lower along the longer direction. Mattey, Edwards and Hood’s cavity study compares cavity estimates with field simulation; their refined estimate includes a small fringing correction omitted in this screening calculation.
Cavity modes vs capacitor antiresonance vs fixture effects
A peak is a clue, not a diagnosis. Compare what changes the peak before changing the board.
| Candidate | What it follows | Useful check |
| Plane cavity mode | Overlap geometry, dielectric and position | Compare predicted bands and probe at multiple locations |
| PDN antiresonance | Interaction between capacitance and inductance in the mounted network | Compare with a validated model or controlled population change |
| Fixture artifact | Launch, cable, calibration or probe geometry | Repeat with stable connections and inspect the fixture response |
Why plane spacing still matters
Moving planes closer changes their distributed capacitance and impedance even when the idealized first-mode frequency expression does not contain their separation. Do not conclude that spacing is unimportant. Real dielectric structures, losses and boundary conditions can change how a resonance appears.
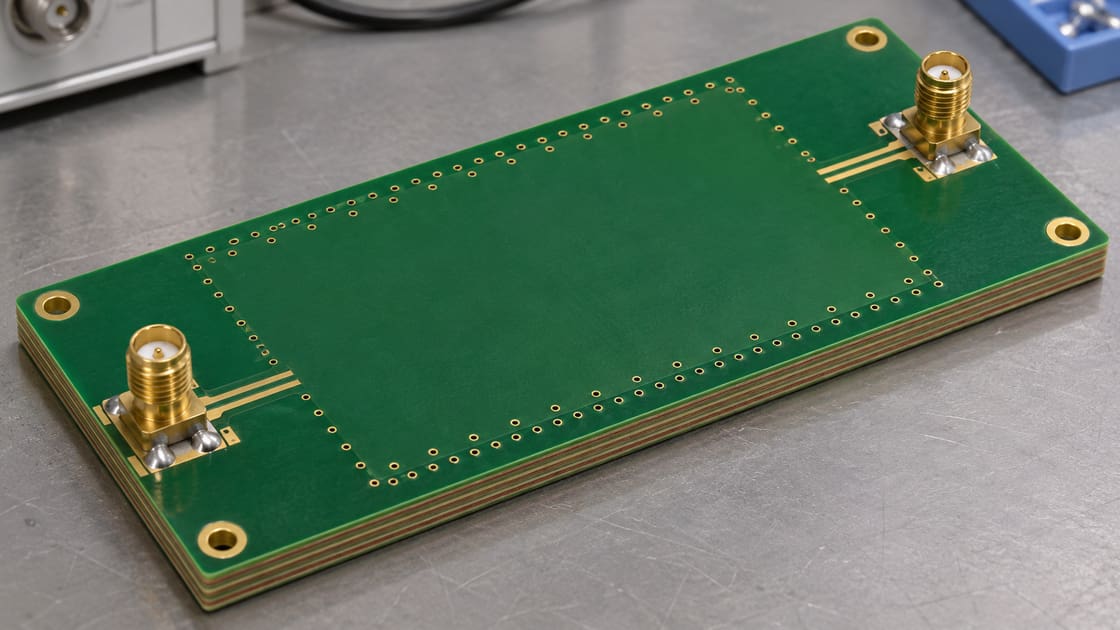
Why the probe location changes what you see
A mode can be weak at one location and strong at another. If the predicted band appears quiet at a single port, try a second point chosen to couple to a different part of the field pattern. Document the port locations so the comparison can be repeated.
When the simple estimate stops being useful
Treat irregular shapes, multiple return planes, heavy segmentation and connected cavities as cases for a model of the actual layout. A rectangle can still identify an order of magnitude, but a precise numerical result would imply geometry the model does not contain.
How to compare an unpopulated and assembled board
Keep the same reference points and fixture when practical. The unpopulated coupon can help isolate geometry; the populated board adds decoupling, package and regulator interactions. A difference between the traces can be meaningful only when the changed conditions are recorded.
How to decide whether the mode matters
Compare the observed response with the frequency content of the excitation and with the requirements at the affected ports. A mode that is not strongly excited may be less significant than a lower-frequency impedance problem. Do not equate a simulated mode with a measured compliance failure.
What to change after identifying the mechanism
If the evidence points to the plane geometry, consider a stackup, shape or damping change supported by modeling and measurement. If the peak instead follows capacitor population or fixture changes, address that mechanism first. Review any layout change for return-path and current-delivery consequences.
What to record for the next design revision
Save the overlap geometry, dielectric assumptions, estimated mode band, port locations, raw data, populated state and the acceptance requirement. Use this with the broader PCB power-integrity workflow. For a stackup or test-coupon manufacturing review, contact Best Technology at sales@bestpcbs.com.
FAQ
Can I use the longest edge of the entire board?
Only if that dimension represents the active rectangular overlap in the model. A power island can be smaller than the overall board, and nearby splits or necks can make even its bounding rectangle misleading. Identify the two conductors and their overlap first.
Which dielectric constant should I use?
Use a documented value appropriate to the actual plane dielectric and the band of interest. For a quick calculation, label an assumed value as such. When several materials or uncertain geometry are involved, compare a bounded range or use an appropriate field model.
Is a frequency estimate enough to choose decoupling capacitors?
No. The calculation estimates where an idealized mode can occur. It does not predict the impedance at a particular device port or the effect of capacitor mounting inductance. Evaluate the actual PDN and verify the relevant band before changing the population.
Why might I see a different peak on a second port?
Different locations can couple differently to the same standing-wave pattern, and the two launches may not be identical. Compare the expected mode shapes, port definitions and fixture behavior before concluding that every observed peak represents a different physical resonance in the PCB.
Can power planes resonate when their DC voltage looks stable?
Yes. A DC reading shows the average or slow behavior at the instrument’s measurement point. A resonant response is frequency-dependent and may only be visible with suitable bandwidth and a defined excitation or measurement configuration. Record both when they answer different questions.
Does a larger board always have a lower cavity mode?
Not necessarily. The relevant dimension is the electrical length of the participating plane overlap, not simply the product outline. The dielectric and boundaries also matter. Compare like geometry and material assumptions before interpreting the direction of any frequency change between designs.
Can I identify a cavity mode from emissions alone?
An emissions peak can indicate a band worth investigating, but it does not isolate the source. Compare near-field or port evidence with geometry and known excitation, and check cables, enclosure and test fixtures before assigning the peak to the plane pair.
Is the calculated frequency a compliance limit?
No. It is a screening estimate for a simplified geometry. Compliance criteria depend on the applicable test and product requirements. Use the estimate to choose what to simulate or measure, and keep the resulting evidence separate from the calculation in the qualification report.