

PCB manufacturing PCB manufacturing
Home > Blog

Watts to Amps Calculator: DC, AC and Three-Phase Formulas

August 5th, 2026

Watts to amps conversion requires the power in watts, the voltage at the same point in the circuit, and the circuit type. For DC, current equals watts divided by volts. Single-phase and three-phase AC calculations may also require power factor, while a conversion based on output power must account for efficiency. Use the calculator and formulas below to obtain a current value, then verify nameplate limits, startup current and conductor or PCB requirements separately.

Watts to Amps Calculator: DC, AC and Three-Phase Formulas

What Does Watts to Amps Mean?

Watts to amps means calculating electrical current from known real power and voltage. Watts measure the rate of energy transfer, amps measure current, and volts describe the electrical potential that drives that current. Because the same power can be delivered at different voltages, one wattage does not correspond to one universal amperage.

For example, a 120 W DC load draws 10 A at 12 V but only 0.5 A at 240 V. The power is unchanged, yet the low-voltage path carries twenty times more current. That difference affects wiring, connectors, fuses, copper losses and PCB conductor design.

How to Convert Watts to Amps?

To convert watts to amps, identify the wattage, voltage and whether the circuit is DC, single-phase AC or balanced three-phase AC. For AC, obtain the power factor from the equipment datasheet or nameplate. If the listed wattage is useful output power rather than electrical input power, include conversion efficiency.

  1. Use power and voltage measured or specified at the same side of the circuit.
  2. Select the formula for DC, single-phase AC or three-phase AC.
  3. Enter power factor for AC equipment instead of assuming it is always 1.
  4. Set efficiency to 100% when the wattage is already input power.
  5. Calculate the steady-state current, then check surge and maximum nameplate current separately.

How Does the Watts to Amps Calculator Work?

The calculator selects the correct current equation for the circuit type and applies power factor and efficiency only where they belong. Three-phase mode assumes a balanced load and line-to-line voltage. If the entered watts are electrical input power, leave efficiency at 100%; if they are output power, enter the expected conversion efficiency.


Result: 8.33 A

DC single-phase AC and three-phase watts to amps formulas

What Is the Watts to Amps Formula for DC?

For DC input power, use I = P / V, where I is current in amps, P is power in watts and V is voltage in volts. A 500 W load at 24 V therefore draws 20.83 A in the ideal calculation.

If 500 W is converter output power and efficiency is 90%, estimate source current with I = Pout / (V x efficiency). At 24 V, the input current becomes 500 / (24 x 0.90) = 23.15 A. For batteries, repeat the calculation at the minimum operating voltage because current rises as voltage falls.

What Is the Watts to Amps Formula for Single-Phase AC?

For single-phase AC real power, use I = P / (V x PF). A 1000 W resistive load at 120 V and PF 1 draws 8.33 A, while a 1000 W load at PF 0.80 draws 10.42 A.

Power factor and efficiency describe different effects. Power factor relates real power in watts to apparent power in volt-amperes; efficiency relates useful output power to electrical input power. If the entered wattage is output power, a practical estimate may require both: I = Pout / (V x PF x efficiency).

What Is the Watts to Amps Formula for Three-Phase AC?

For a balanced three-phase load using line-to-line voltage, use I = P / (sqrt(3) x VLL x PF). A 5000 W load at 400 V and PF 0.90 draws 8.02 A before any efficiency correction.

When phase-to-neutral voltage is used, the balanced-load equation is I = P / (3 x VLN x PF). Do not mix line-to-line and line-to-neutral voltage in the same formula. Unbalanced equipment requires phase-by-phase evaluation rather than the balanced shortcut.

What Is the Difference Between Watts, Amps and Volts?

Watts describe power, amps describe current and volts describe electrical potential. The three quantities are related, but they are not interchangeable units.

Quantity Unit What it describes Basic DC relation
Power Watt (W) Energy transferred per unit time P = V x I
Current Ampere (A) Rate of electric charge flow I = P / V
Voltage Volt (V) Electrical potential difference V = P / I

In AC systems, the simple product V x I gives apparent power when waveform and phase effects are present. Real power in watts also depends on power factor, which is why the equipment nameplate may list volts, amps, watts and VA separately.

What Is the Watts to Amps Conversion at 12V, 24V and 48V?

At low DC voltage, current increases rapidly as power rises. The table uses I = P / V and assumes the wattage is input power with no additional conversion loss.

Power 12 V DC 24 V DC 48 V DC
100 W 8.33 A 4.17 A 2.08 A
500 W 41.67 A 20.83 A 10.42 A
1000 W 83.33 A 41.67 A 20.83 A
2000 W 166.67 A 83.33 A 41.67 A

These are steady-state arithmetic values. A 12 V inverter delivering 1000 W of AC output will draw more than 83.33 A from the battery because the inverter is not 100% efficient and battery voltage can sag under load.

What Is the Watts to Amps Conversion at 120V, 220V and 240V?

For a resistive single-phase AC load with PF 1, divide watts by the supply voltage. Loads with a lower power factor draw more RMS current than this table shows.

Power 120 V AC 220 V AC 240 V AC
100 W 0.83 A 0.45 A 0.42 A
500 W 4.17 A 2.27 A 2.08 A
1000 W 8.33 A 4.55 A 4.17 A
2000 W 16.67 A 9.09 A 8.33 A
Watts to amps values at low-voltage DC and common AC voltages

For dedicated values and additional assumptions, see the existing 1000 and 1500 watts to amps guide. Keeping those fixed-power examples on their own page prevents the general calculator from repeating the same material.

How Does Power Factor Change Watts to Amps?

A lower power factor increases AC current for the same real power and voltage. At 120 V, a 1000 W load draws 8.33 A at PF 1, 9.26 A at PF 0.90 and 10.42 A at PF 0.80.

Use the power factor specified for the operating condition. Motors may have different values at startup and partial load, while switch-mode power supplies with power-factor correction can behave differently from units without it. If a nameplate gives VA rather than W, divide VA by voltage to estimate current instead of treating VA as real power.

How Do Efficiency and Inverter Losses Change Current?

Efficiency raises the required input current when the known wattage is output power. A 1000 W inverter with 90% efficiency requires about 1111 W of DC input. At 12 V, that equals 92.59 A before voltage sag, cable loss and no-load consumption are added.

Calculate each side of a converter separately. The 120 V AC output current for a 1000 W resistive load is 8.33 A, but the 12 V battery input current can exceed 90 A. The watts remain in the same range, while the current changes because the voltage changes and losses must be supplied upstream.

Power factor and inverter efficiency effects on watts to amps

Why Can Measured Current Differ from the Calculated Value?

Measured current differs when the calculation omits operating conditions that exist in the real circuit. Nameplate tolerances, voltage variation, power factor, conversion loss, load duty cycle and instrument bandwidth can all move the reading.

  • Startup current: motors, transformers and capacitive inputs can draw a short surge above steady-state current.
  • Changing load: controllers and switch-mode supplies may pulse or vary their input current.
  • Voltage sag: lower source voltage produces more current when the load maintains constant power.
  • Measurement method: distorted AC waveforms require a suitable true-RMS instrument.
  • Input versus output rating: an output wattage cannot be divided by input voltage without including efficiency.

Use the formula as an estimate and compare it with the maximum nameplate current and measurements at minimum voltage, full load and startup. Protective devices and conductors must be selected from the applicable standard and equipment requirements, not from one ideal conversion alone.

How Do Watts to Amps Calculations Affect PCB Design?

The calculated current is an input to PCB design, not a complete trace-width rule. Copper thickness, layer location, trace length, allowable temperature rise, ambient temperature, airflow, via arrays, terminal resistance and duty cycle determine how the current path should be implemented.

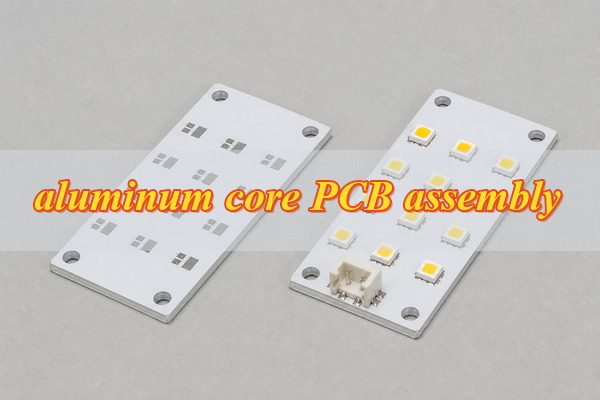
Low-voltage power stages can require wide conductors, copper pours, busbars or a heavy copper PCB. High-power LED and converter assemblies may use a metal core PCB when heat spreading is a central requirement. Complete PCB assembly validation must also consider power-device packages, connectors, solder joints, fuses and current sensing.

High-current PCB copper paths after a watts to amps calculation

EBest Circuit (Best Technology) lists Extreme Heavy Copper PCB capability up to 200 OZ, subject to material selection, layer stack-up, board dimensions, design complexity, quantity and engineering review. Available verification processes include copper thickness testing, while PCBA inspection can include AOI, X-ray, functional testing and final inspection. These checks validate the manufactured current path; they do not replace electrical and thermal design calculations.

What Common Watts to Amps Mistakes Should Be Avoided?

The most common errors come from choosing incomplete inputs or applying a correct formula to the wrong circuit type.

  • Converting watts without specifying voltage.
  • Using the DC equation for an AC load with power factor below 1.
  • Using the single-phase formula for a three-phase system.
  • Mixing line-to-line and line-to-neutral voltage.
  • Using output watts as input watts without an efficiency correction.
  • Confusing amps with amp-hours, which measure current and charge capacity respectively.
  • Ignoring surge current, minimum supply voltage or current-limit behavior.
  • Using the calculated current as the final breaker, cable, connector or PCB rating.

FAQ About Watts to Amps

1. How many amps is 100 watts?

One hundred watts equals 8.33 A at 12 V DC, 4.17 A at 24 V DC, 0.83 A at 120 V and 0.42 A at 240 V when PF is 1. For AC equipment with a lower power factor, divide by voltage and power factor.

2. What is 20 amps in watts?

Multiply current by voltage. Twenty amps equals 240 W at 12 V, 2400 W at 120 V and 4800 W at 240 V for DC or a resistive PF 1 load. For AC real power, multiply volts by amps and power factor.

3. Is 1 amp 1000 watts?

No. One amp equals 12 W at 12 V, 120 W at 120 V and 240 W at 240 V under the simple DC or PF 1 relation. Reaching 1000 W at 1 A would require 1000 V under that same assumption.

4. How to convert watts to amps 240V?

For DC or a resistive single-phase 240 V load, divide watts by 240. A 1000 W load equals 4.17 A and a 2000 W load equals 8.33 A. For AC equipment, include power factor and use the correct phase formula.

Conclusion

Accurate watts to amps conversion starts with the correct voltage and circuit type. DC uses I = P / V, single-phase AC adds power factor, and balanced three-phase AC adds the sqrt(3) factor when line-to-line voltage is used. Efficiency, startup current and minimum voltage explain why measured or upstream current can be higher than the ideal result. For power PCB fabrication and assembly support after the electrical requirements are defined, contact EBest Circuit (Best Technology) at sales@bestpcbs.com.

PCB Panel Sizes Explained: How to Maximize Board Yield and Reduce Manufacturing Cost

August 5th, 2026

PCB panel sizes are not governed by one universal standard. An 18 × 24 in fabrication panel is a common reference, while an SMT assembly panel is usually smaller and must fit every machine in the line. The right size depends on usable area, board dimensions, rails, spacing, depaneling, rigidity, and equipment limits.

This distinction matters because the sheet purchased by a fabricator, the area available for nesting boards, and the panel delivered to an assembly line are not necessarily the same size. A panel that looks efficient in CAD can still fail at the stencil printer, sag in reflow, or leave insufficient clearance for depaneling. Use the following framework to compare common PCB panel sizes before approving the array.

PCB panel sizes shown on a production-ready circuit board array

What Are the Most Common PCB Panel Sizes?

There is no single standard PCB panel size used by every fabricator and assembler. The PCB panel sizes below are practical references seen in fabrication and assembly planning. They are starting points—not guaranteed machine limits or a substitute for supplier confirmation.

Panel reference Approximate inches Typical planning role Important limitation
250 × 250 mm 9.84 × 9.84 in Compact assembly array or smaller fabrication format Usable area is smaller after rails and process margins
250 × 300 mm 9.84 × 11.81 in Compact SMT panel reference Must fit the narrowest machine and conveyor setting
300 × 400 mm 11.81 × 15.75 in Medium assembly or fabrication reference Rigidity depends on thickness, cutouts, copper, and support
400 × 500 mm 15.75 × 19.69 in Larger-format planning reference May be too large for some SMT lines or fixtures
457 × 610 mm 18 × 24 in Widely referenced fabrication panel Full sheet dimensions do not equal usable nesting area
508 × 610 mm 20 × 24 in Alternative fabrication format Availability and processing rules vary by supplier
610 × 914 mm 24 × 36 in Large raw-material or fabrication reference Usually subdivided before assembly handling

The best reference size is the one that creates a manufacturable array with acceptable yield, stable handling, and a clean depaneling path. Ask whether a quoted dimension describes raw laminate, a fabrication working panel, or the finished delivery array.

Fabrication Panel vs Usable Area vs SMT Assembly Panel

PCB panel sizes can describe four different objects. Confusing them is one of the most common causes of incorrect yield estimates.

Panel term Purpose Main constraint What to confirm
Raw or full fabrication panel Starting laminate or working sheet Fabrication equipment and material format Whether quoted dimensions are raw or process-ready
Usable fabrication area Area available for boards and required features Process margins, coupons, tooling, and routing space Confirmed usable width and height
Customer array or delivery panel Multiple boards shipped together Array count, rails, depaneling, packing, and handling Overall dimensions and delivery condition
SMT assembly panel Carrier through printing, placement, reflow, AOI, and test The narrowest handling window across the line Minimum, maximum, thickness, rail, and support requirements

A fabricator may optimize several customer arrays within one working panel, but the assembler only handles the delivery panel. This is why PCB fabrication panel size and PCB assembly panel size should be checked separately.

Full PCB Panel Size vs Usable Panel Area

When comparing PCB panel sizes, usable panel area is the full panel area minus process margins and reserved zones. A simple first-pass model is:

Usable width = full width − left margin − right margin
Usable height = full height − top margin − bottom margin

Margins may contain tooling holes, global fiducials, impedance coupons, plating thieving, test structures, barcodes, or gripping zones. Router paths and breakaway rails also consume space. Therefore, an 18 × 24 PCB panel does not provide a universal 18 × 24 in usable area.

For example, if an 18 × 24 in working panel requires a 0.5 in reserved zone on each side, the simplified usable rectangle becomes 17 × 23 in. This is only a calculation example; actual process margins must come from the fabricator. Complex routing, coupons, or process constraints may reduce the usable region further.

Top-down PCB panel showing the array, edge rails, tooling holes, and usable area

How to Calculate PCB Panel Size and Boards per Panel

Calculate both board orientations before choosing among PCB panel sizes. Let the usable panel dimensions be Uw and Uh, board dimensions be Bw and Bh, and the required gap between boards be G.

Columns = floor((Uw + G) ÷ (Bw + G))
Rows = floor((Uh + G) ÷ (Bh + G))
Boards per panel = columns × rows

Worked example. Assume a 300 × 400 mm delivery panel with 10 mm rails on all four sides. The simplified usable area is 280 × 380 mm. The single board is 70 × 95 mm, and the selected routing strategy requires a 2 mm gap.

  • At 0°: floor((280 + 2) ÷ (70 + 2)) = 3 columns; floor((380 + 2) ÷ (95 + 2)) = 3 rows; total = 9 boards.
  • At 90°: floor((280 + 2) ÷ (95 + 2)) = 2 columns; floor((380 + 2) ÷ (70 + 2)) = 5 rows; total = 10 boards.
  • Board-area utilization for the 2 × 5 option is (10 × 70 × 95) ÷ (300 × 400) = 55.4% of the full delivery-panel area.

The rotated layout fits one more board, but quantity is not the only approval criterion. The 2 × 5 array must still pass checks for rail direction, conveyor support, component orientation, copper balance, tooling access, and depaneling stress. If it becomes long and flexible, the 3 × 3 option may be safer despite its lower count.

Minimum and Maximum PCB Panel Size Across the SMT Line

The minimum and maximum PCB panel sizes for assembly are set by the complete line, not by one machine in isolation. Check the stencil printer, loader, conveyor, pick-and-place machine, reflow oven, AOI, ICT or FCT fixture, depaneling equipment, and any manual carriers. The smallest maximum—or the largest minimum—becomes the controlling limit.

  • Too small: the board may not clamp, convey, or expose enough edge area for fiducials and tooling.
  • Too large: the panel may exceed a transport window, fixture, stencil format, or safe manual-handling range.
  • Too flexible: a nominally acceptable panel may sag during printing, placement, or reflow.
  • Too heavy: dense components or metal structures may overload support assumptions.

BestPCBS separates standard-process dimensions from special-process review in its controlled PCB Manufacturing Capability data. The following values describe confirmed finished-board and V-cut capabilities; they are not universal industry standards and do not replace a project-specific panel review.

Confirmed capability item Standard process Special process or review condition
Finished board maximum dimension Within 600 mm Single/double-sided FR-4: 600–1980 mm; multilayer FR-4: 600–750 mm
Finished board minimum dimension 5 mm A single side of 5–10 mm is shipped by panel
Minimum distance between two V-cut lines 8 mm Array interaction requires engineering confirmation
V-cut board thickness range 0.6–3.5 mm More than 4 mm requires a special process
Minimum trace-to-board-edge distance for V-cut or routing 8 mil Component and mechanical clearances still require DFM review

A PCB can be fabricable yet unsuitable for an SMT line, so the finished delivery panel must be approved against assembly equipment as well as fabrication capability.

How Rails, Board Spacing, Tooling Holes, and Fiducials Change Panel Dimensions

Every handling feature uses panel area. Add these features before calculating final yield, not after the array count has been fixed.

Design element Why it is used Effect on dimensions Who confirms it
Edge rails Conveyor support, clamping, fiducials, and edge clearance Increase overall width, height, or both Assembler with fabricator review
Board spacing Allows scoring, routing, tabs, and safe separation Accumulates between every row and column Fabricator based on depaneling method
Tooling holes Locates the panel in fixtures and processes Requires reserved rail or margin area Assembler and fixture owner
Global fiducials Aligns the complete panel for printing and placement Requires clear optical zones, usually on rails Assembler
Local fiducials Improves alignment for fine-pitch devices or individual boards Uses board-level surface area PCB and assembly engineers
Coupons and labels Supports process control, traceability, or testing Consumes fabrication or rail space Fabricator and quality team

A complete panel drawing should identify the overall dimensions, board array, rails, board spacing, score or router path, tabs, tooling holes, fiducials, orientation, coupon area, barcode zone, and bad-board marking method. Do not assume one tooling-hole or rail dimension works for every production line.

V-Score vs Tab Routing: How the Method Changes Panel Size

V-scoring suits straight, continuous separation lines and regular rectangular arrays. Tab routing supports irregular outlines and selective separation, but it needs router clearance, tabs, and often mouse-bite finishing. The method changes both the required spacing and the residual stress at the board edge.

Decision factor V-score Tab routing
Board outline Best for straight shared edges Works with curves and irregular shapes
Spacing Can support closely arranged straight edges, subject to process rules Needs a router path plus tab locations
Edge result Leaves a scored separation edge May leave tab or mouse-bite witness marks
Component risk Board bending during separation can stress nearby parts Tab cutting can reduce bending but needs tool clearance
Panel rigidity Long score lines can weaken the array Tab number and placement control stiffness

Minimum and maximum V-cut panel size are supplier- and equipment-specific. Confirm V-cut line spacing, board thickness, component clearance, scoring direction, and permitted edge condition before finalizing the panel.

How Board Thickness, Weight, and Copper Balance Affect Panel Stability

A larger panel is not automatically more economical. Thin laminates, long unsupported spans, large cutouts, asymmetric copper, heavy components, and too few connecting tabs can produce sag or twist. That movement can affect solder-paste release, placement height, reflow support, AOI focus, and depaneling.

Request engineering review when the panel combines two or more risk factors: a long aspect ratio, thin construction, dense copper on one side, heavy connectors, large routed openings, components close to break lines, or narrow rails. Possible responses include changing orientation, reducing the array, widening rails, adding temporary support, balancing copper, repositioning tabs, or using a carrier.

PCB assembly panel moving through an SMT production line with supported edge rails

How PCB Panel Size Affects Material Utilization and Cost

The economics of PCB panel sizes include more than laminate area. Cost can be affected by the number of boards per working panel, routing time, wasted edge strips, rail area, tooling, stencil and fixture compatibility, assembly handling, test access, depaneling labor, and the risk of damaging multiple boards at once.

A high-count array may look attractive but lose its advantage if it needs a custom carrier, slows handling, or increases breakaway damage. Compare at least two orientations and, where practical, two delivery-panel sizes. For a realistic quotation, pair the proposed layout with the quantity and process data described in a custom PCB cost guide.

The useful target is not maximum geometric utilization. It is the lowest stable cost per acceptable board after fabrication, assembly, test, and depaneling constraints are included.

How to Choose the Right PCB Panel Size

  1. Confirm the exact single-board outline, thickness, stack-up, copper weight, and edge-mounted components.
  2. Ask the fabricator for its working-panel formats, confirmed usable area, process margins, and relevant special-process limits.
  3. Ask the assembler for the minimum and maximum handling dimensions of every machine and fixture in the line.
  4. Select V-score, tab routing, or another approved separation method based on outline, edge quality, and component stress.
  5. Add rails, board gaps, fiducials, tooling holes, coupons, and traceability zones.
  6. Calculate both 0° and 90° layouts, including the spacing between every row and column.
  7. Review stiffness, copper balance, component weight, conveyor support, and depaneling forces.
  8. Approve one controlled panel drawing with the fabricator and the provider of custom PCB assembly services.

Early joint review prevents the common handoff problem in which a fabrication-efficient panel has to be rebuilt for SMT. It also gives both suppliers one agreed definition of the overall panel dimensions and usable area.

What Information Should You Send for PCB Panel Review?

Send enough information for the fabricator and assembler to evaluate the same panel—not separate assumptions.

  • Gerber, ODB++, IPC-2581, or another reviewable PCB data package
  • Board outline, single-board dimensions, thickness, stack-up, and copper weight
  • Required board quantity per delivery panel, or permission to optimize the array
  • Assembly side, component overhang, edge clearance, and process flow
  • V-score or tab-route preference and the required finished edge
  • Rail, fiducial, tooling-hole, barcode, coupon, and bad-board marking requirements
  • Delivery condition: individual boards, bare-board panels, or assembled panels
  • Order quantity, test method, fixture constraints, and depaneling responsibility

If no customer array is mandatory, submit the single-board production files and ask the fabricator to propose a panel for joint DFM approval. That approach is often safer than locking dimensions before the SMT line and separation method are known.

FAQs About PCB Panel Sizes

Q1. Is there one universal standard PCB panel size?

A1. No—there is no universal panel size. Common dimensions are planning references. Each fabricator and assembler has its own material formats, process margins, equipment windows, and preferred arrays. Confirm whether a stated size means a raw sheet, usable fabrication area, or delivery panel.

Q2. How many PCBs fit on an 18 × 24 inch panel?

A2. The count depends on usable area and layout rules. Subtract fabrication margins, rails, coupons, router paths, and required spacing, then calculate both board orientations. Board outline, depaneling method, and process support can make the highest geometric count unsuitable.

Q3. Do panel rails count toward the overall PCB panel dimensions?

A3. Yes—rails are normally included in the delivered panel dimensions. They consume space but provide conveyor support, clamping area, tooling locations, and global fiducials. State both the overall panel size and the internal array size on the drawing.

Q4. What is the minimum PCB panel size for SMT assembly?

A4. The assembly line determines the practical minimum. A small board may need rails or a multi-board array so the printer, conveyor, placement machine, reflow oven, and inspection equipment can grip and transport it reliably.

Q5. What is the maximum V-cut PCB panel size?

A5. There is no universal maximum V-cut size. The limit depends on the supplier’s scoring equipment, material, thickness, score direction, panel rigidity, and downstream assembly line. Obtain a project-specific confirmation instead of applying another supplier’s published number.

Q6. Should I panelize the PCB myself or let the manufacturer do it?

A6. Let the manufacturer optimize it unless your assembly line requires a controlled array. If you provide the panel, have both fabrication and assembly teams review it. Never assume a CAD array is production-ready without checking tooling and depaneling.

Q7. When should small or prototype PCBs be panelized?

A7. Panelize when individual handling is unreliable or inefficient. Very small boards often need rails or an array for solder-paste printing, placement, reflow, inspection, or test. For low quantities, balance easier handling against panel setup and depaneling work.

Q8. Can different PCB designs share one panel?

A8. Mixed-design panels are possible only with supplier approval. Different outlines, copper distribution, layer constructions, quantities, and test requirements can complicate fabrication and assembly. Confirm fabrication rules, traceability, bad-board handling, and order acceptance before nesting different designs.

Q9. Does rotating boards reduce PCB panel cost?

A9. Rotation can improve yield, but it does not always reduce total cost. A rotated layout may fit more boards yet create poor conveyor support, unfavorable grain or copper behavior, awkward component orientation, or greater depaneling risk. Compare the complete process.

Q10. What panel files should be approved before production?

A10. Approve one dimensioned panel drawing and its production data. The package should show the array, overall size, rails, gaps, score or router paths, tabs, fiducials, tooling holes, orientation, labels, coupons, and bad-board marking requirements.

Conclusion

PCB panel sizes should be chosen by working backward from usable fabrication area, assembly-line handling, depaneling, and mechanical stability. Common PCB panel sizes provide a useful starting point, but the approved panel must reflect the actual board, process, and supplier limits. Calculate both orientations, include every rail and gap, and have fabrication and assembly review the same controlled drawing.

Send your Gerber files, board outline, assembly side, quantity, and preferred delivery format to sales@bestpcbs.com for a DFM panel review.

Tin Price Surge in 2026: What It Means for Solder and PCBA Cost

August 4th, 2026

Tin price 2026 volatility matters to electronics buyers because tin is the dominant metal in common PCB assembly solders. On January 15, the International Tin Association reported that the LME three-month contract had closed at US$53,462 per metric tonne, a nominal record at that time.

The important procurement lesson is narrower than “all PCBA prices must rise.” A metal benchmark can pressure solder paste, wire and bar costs, but the effect on a finished assembly depends on alloy, solder consumption, inventory timing, board complexity, labor, component cost and the commercial terms of the quotation.

Tin Price 2026 and its effect on solder and PCBA cost

What Happened to the Tin Price in 2026?

Tin moved to historically high nominal levels early in 2026 and remained expensive and volatile into July. The International Tin Association recorded a US$53,462/t three-month close in mid-January. On the LME public delayed page, the latest accessible dated snapshot used for this article showed a US$52,400/t three-month offer and a US$53,230/t three-month closing price for July 27.

Those figures are reference points, not a supplier quotation. Tin is quoted in US dollars per metric tonne, while a buyer purchases a processed solder product with a defined alloy, powder size or wire diameter, flux system, package size, delivery location and payment term.

Dated Reference Value How to Use It
January 15, 2026 ITA report LME 3-month close: US$53,462/t Confirms the early-year nominal record
July 27, 2026 LME delayed data 3-month offer: US$52,400/t Later benchmark for directional comparison
July 27, 2026 LME delayed data 3-month close: US$53,230/t Shows that elevated pricing persisted, with daily volatility

How Should Buyers Read Tin Price Today and a Tin Price Chart?

Tin price today is only a dated market signal; a tin price chart is more useful when it is read with contract type, currency, unit and observation date. Cash, three-month and monthly contracts can show different values, and a delayed public page is not the same as a live tradeable price.

Before comparing a metal chart with a solder quotation, check:

  • whether the figure is cash, three-month or another contract;
  • whether it is a bid, offer, settlement or closing price;
  • whether the unit is US$/t, US$/kg or a local-currency unit;
  • the business date and whether the data are delayed;
  • the quotation validity period and the supplier’s inventory date.
Tin Price Chart with dated LME reference points in 2026

Why Has Tin Been So Volatile?

The 2026 rally combined persistent supply concerns with investment-driven price movement in a relatively small market. The International Tin Association pointed to continuing disruption in Myanmar and the Democratic Republic of Congo, a temporary Indonesian export pause around permit renewals, higher investor activity, broader base-metal strength and a weaker US dollar.

That combination can move prices faster than physical electronics demand alone would justify. It also means a high price can correct sharply. Buyers should therefore avoid treating one intraday spike as a permanent cost floor or using one historical low as a guaranteed purchasing target.

Why Does Tin Cost Matter to Electronics Solder?

Tin matters because it represents most of the metal content in widely used electronic solder alloys. SAC305 lead-free solder is 96.5% tin, 3.0% silver and 0.5% copper. Traditional Sn63Pb37 solder contains 63% tin and 37% lead.

The exposure is not identical:

  • SAC305: highly sensitive to tin, but silver and copper also affect alloy cost.
  • Sn63Pb37: has lower tin content, but regulatory and product requirements limit where leaded solder may be used.
  • Low-silver and specialized alloys: use different metal mixes and cannot be priced by applying the SAC305 ratio.
  • Solder paste: includes metal powder plus flux chemistry, processing, packaging and shelf-life controls.

For more alloy and process context, see our guides to leaded versus lead-free solder and lead-free solder material.

SAC305 and Sn63Pb37 solder alloy composition comparison

How Does Tin Price Affect Tin Solder Price?

Tin solder price usually feels upward pressure when the tin benchmark rises, but it does not move by the same percentage or on the same day. A solder producer may be using metal bought earlier, a monthly average, a contract formula or replacement-cost pricing.

A practical solder quotation can include:

  • the value of tin, silver, copper, lead or other alloying metals;
  • alloying, refining and powder-atomization conversion costs;
  • flux chemistry for paste or cored wire;
  • wire drawing, bar casting, testing and packaging;
  • freight, currency conversion, minimum order quantity and supplier margin.

This is why a quote should state the exact alloy and product form. “Solder” alone is not a controlled purchasing description.

How Could Lead Free Solder Price Respond?

Lead free solder price can be especially exposed to tin because common SAC alloys contain more than 95% tin by weight. However, the total price also reflects silver content, flux system, powder size, quality controls and packaging, so the response can be delayed or amplified relative to the LME move.

For solder paste, buyers should also confirm alloy, powder type, flux classification, package size, storage condition and expiry date. Substituting a cheaper paste without checking wetting, voiding, residue, stencil transfer and reliability requirements can create a process cost larger than the material saving. Our explanation of solder paste and its function covers those process variables.

Does a Tin Price Increase Equal the Same PCBA Price Increase?

No. A tin-price percentage must not be copied directly into a PCBA-price percentage. Solder is only one input to an assembled board, and its share varies greatly by product.

Cost Element Relationship to Tin What Changes the Impact
Solder paste Direct metal-content exposure Alloy, deposit volume, transfer efficiency and waste
Wave solder bar Direct alloy exposure Bath size, dross generation, replenishment and recovery
Components Mostly indirect BOM mix, lead time, allocation and supplier pricing
Bare PCB Limited direct solder input Surface finish, laminate, copper and fabrication complexity
Assembly labor and testing No direct metal formula Placement count, inspection, test coverage and rework

A dense through-hole assembly using wave solder may consume more solder per unit than a small, fine-pitch SMT board. A component-heavy assembly may have a high total price but a small solder-cost share. The correct calculation starts with actual process consumption, not a headline metal percentage.

Which Build Factors Amplify or Limit the Cost Impact?

Solder usage, purchase timing and product design determine how visible tin volatility becomes in a PCBA quotation. The main variables are:

  • Assembly process: SMT paste printing, selective soldering, wave soldering and hand soldering consume different forms and quantities.
  • Joint count and volume: connector pins, large terminals, thermal pads and through-hole barrels can raise metal consumption.
  • Alloy requirement: SAC305, Sn63Pb37 and specialized alloys have different metal exposure and qualification limits.
  • Production yield: paste waste, dross, rework and scrap convert purchased material into different numbers of accepted boards.
  • Order size and timing: a prototype may use little solder per order, while volume production can justify negotiated material terms.
  • Quote validity: long validity periods carry more commodity and currency risk than short, dated offers.
PCBA cost review of solder alloy, BOM and manufacturing factors

What Should PCB Assembly Buyers Do Before Placing Orders?

Buyers should stabilize technical requirements first, then ask how the quotation handles material validity and substitution. A useful package includes:

  • Gerber files, fabrication notes and the current BOM revision;
  • approved solder alloy and any RoHS or product-specific restrictions;
  • expected quantity, batch schedule and delivery destination;
  • assembly drawing, stencil requirements and special process notes;
  • test requirements, acceptable alternates and change-approval rules.

Ask for the quote date, validity period, currency, Incoterm, material assumptions and any escalation clause. For repeat builds, forecasted releases can help separate genuine material changes from emergency purchasing premiums. Our PCB assembly services and SMT PCBA process pages explain the manufacturing information needed for quotation and production planning.

FAQ About Tin Price 2026 and PCBA Cost

Did tin reach a record price in 2026?

Yes. The International Tin Association reported a nominal record LME three-month close of US$53,462/t in January 2026.

Is the LME tin price the same as a solder supplier price?

No. LME tin is a metal benchmark. A solder price includes alloying metals, conversion, flux or wire processing, testing, packaging, freight and commercial terms.

Why can tin price today differ from a supplier quote?

The dates, contract references, currencies, inventory positions and averaging methods may differ. A supplier may also have bought metal before the current market move.

Does SAC305 contain mostly tin?

Yes. SAC305 contains 96.5% tin, 3.0% silver and 0.5% copper by weight.

Will every lead-free alloy change by the same amount?

No. Alloy composition, supplier inventory, conversion cost and purchase terms vary.

Does a higher tin price automatically increase bare PCB cost?

Not by the same direct mechanism as solder. Bare-board cost is more strongly affected by laminate, copper, surface finish, dimensions and process complexity.

Which assembly process uses the most solder?

There is no universal answer. Wave and selective soldering can consume substantial bar solder, while SMT consumption depends on stencil deposits, pad count and rework.

Should buyers switch solder alloy to reduce cost?

Only after engineering and compliance review. Alloy changes can affect process temperatures, wetting, reliability, inspection and product qualification.

How often should buyers check a tin price chart?

Check it when planning large or repeat orders, but compare dated averages and quotation terms rather than reacting to every intraday move.

What information helps a PCBA supplier quote accurately?

Provide Gerbers, BOM, assembly drawings, alloy and compliance requirements, quantity, schedule, test plan and approved substitution rules.

Market conditions continue to change, so this tin price 2026 article uses dated public reference points rather than presenting a live quotation.

How Can EBest Circuit Help Plan PCBA Builds During Tin Price Volatility?

At EBest Circuit, we review the BOM, assembly process, solder-alloy requirement, production quantity and test plan together so the quotation reflects the actual build instead of a headline metal percentage. For a current PCB or PCBA project, send your Gerber files, BOM, quantity and schedule to sales@bestpcbs.com. We will evaluate the applicable materials and manufacturing route for your project.

PCB Thermal Simulation Guide: Model Inputs, Workflow, and Validation

August 4th, 2026

PCB thermal simulation predicts component, board, and airflow temperatures before a layout is released for production. A credible result depends less on a colorful heat map than on accurate power loss, stack-up geometry, material properties, enclosure conditions, and correlation measurements. This guide explains how to choose model fidelity, build realistic heat paths, diagnose misleading outputs, and turn simulation into a design decision supported by traceable assumptions and measurable acceptance limits.

PCB thermal simulation model compared with a powered circuit board in a validation lab

What Is PCB Thermal Simulation and What Can It Actually Predict?

PCB thermal simulation estimates temperature and heat flow for one defined electrical load and environment. Finite-element and finite-volume solvers divide the geometry or flow domain into smaller regions and solve the governing energy equations across them. The model can predict steady temperatures, warm-up behavior, heat-flow paths, airflow patterns, and the effect of design changes. The result is conditional, not universal. A 92°C hotspot is meaningful only when the modeled ambient temperature, component losses, copper geometry, airflow, contact resistance, and operating time match the decision being made. The model can compare alternatives and expose risk early, but it cannot prove production compliance without representative hardware measurements.

  • Temperature field: estimates junction, case, board-surface, and enclosure temperatures at defined locations.
  • Heat-flow path: shows whether energy leaves through copper, vias, a heat sink, the chassis, or surrounding air.
  • Design comparison: quantifies the direction and approximate magnitude of change between controlled variants.
  • Validation limit: cannot compensate for unknown losses, poor boundary conditions, or an uncalibrated material model.

Which Inputs Control PCB Thermal Simulation Accuracy?

The most influential inputs are component power dissipation, board construction, material properties, package thermal models, mechanical contacts, and the operating environment. Record each input with its source, condition, revision, and uncertainty. A nominal value copied from a datasheet may be unsuitable when the real duty cycle, switching loss, airflow, or mounting condition differs. Before solving, assign an owner to every high-sensitivity input and define how it will be verified. This prevents a later layout, BOM, stack-up, or enclosure revision from silently invalidating the thermal conclusion.

Input Required Detail Failure if Wrong Verification
Power loss Watts by component and operating state Hotspot magnitude shifts directly Electrical loss calculation or measured input/output power
Stack-up Layer thickness, copper coverage, dielectric thickness In-plane and through-plane spreading are distorted Released fabrication stack-up and Gerber or ODB++ data
Material Conductivity, density, heat capacity, temperature dependence Steady and transient results drift Supplier data for the specified grade
Environment Ambient, pressure, orientation, airflow, enclosure vents Convection is over- or underestimated Product operating specification and airflow measurement
Contact TIM thickness, clamp pressure, surface area, interface resistance Board-to-case path appears unrealistically efficient Mechanical drawing, assembly method, and correlation test

How Do Conduction, Convection, Radiation, and PCB Construction Shape the Model?

The model must represent every heat-transfer mechanism that can change the design decision. Conduction dominates through copper, laminate, packages, thermal vias, interface materials, and chassis contacts. Convection moves heat between surfaces and air, while radiation exchanges energy according to temperature, emissivity, and view factors. Board orientation matters in natural convection because buoyant air follows gravity; horizontal and vertical boards can produce different flow patterns. Forced convection requires a fan curve or measured flow field, not an arbitrary velocity. Radiation often has a smaller effect near room temperature but can matter for hot surfaces or sealed assemblies. Run a sensitivity case before removing a mechanism to reduce solve time.

PCB thermal model heat path from component loss through copper, vias, interfaces, enclosure and air

How Should Component Power Loss Be Converted into Heat Sources?

Convert electrical operation into heat where each loss actually occurs. Use total device dissipation only when a compact representation is sufficient; separate die, package, lead, pad, and copper loss when the internal heat path changes the decision. For regulators, MOSFETs, magnetics, resistors, and high-current interconnects, calculate loss at the worst credible voltage, current, switching frequency, duty cycle, and temperature. A practical energy check is sum of modeled heat sources = expected dissipated electrical power for the simulated state. If a 20 W converter delivers 17 W to its load, the model should explain the remaining 3 W across semiconductors, magnetics, copper, and passive parts. Do not assign the full input power as heat unless the equipment actually dissipates it.

  1. Define the operating state: nominal, overload, startup, standby, or cyclic mission profile.
  2. Calculate electrical losses: include conduction, switching, core, winding, ESR, and Joule losses where relevant.
  3. Map losses spatially: place them in the die, package, winding, trace, or copper region that produces the heat.
  4. Close the energy balance: reconcile source totals against measured or calculated system loss.

The PCB is thermally anisotropic, so copper geometry and via connections must be represented deliberately. Copper spreads heat more effectively along a layer than typical laminate transfers it through the thickness. Treating the board as one isotropic block can miss copper pours, plane interruptions, thermal necks, and via arrays. Use trace mapping around critical paths and an orthotropic model elsewhere when solve time must be controlled. Thermal vias require barrel diameter, plating, finished hole, pitch, span, pad connection, fill material, and destination plane; count alone is not a thermal specification. A via that terminates on an isolated pad or reaches a plane with no external sink may redistribute heat without lowering final component temperatures. Compare the complete path from the source pad to receiving copper, the interface, and ambient air.

Model Level Geometry Best Use Main Risk
Lumped board Single effective block Early enclosure trade study Misses local copper and via paths
Orthotropic board Directional effective properties System airflow with board-level spreading Depends on correct copper fractions
Trace-mapped board Imported copper by layer Hotspot and power-path decisions Higher mesh and setup cost
Localized detailed region Detailed pad, vias, package and TIM Critical component thermal path Bad interfaces dominate the answer

Which Boundary Conditions and Time Model Fit the Decision?

A thermal result is valid only for its stated boundaries and operating time. Define ambient temperature, enclosure walls, openings, airflow or fan behavior, gravity direction, external heat sources, mounting contacts, heat-sink interfaces, and imposed temperature or heat-flux boundaries. Each condition must match the product state used for the loss inputs. Use a fan performance curve when resistance changes with vents, filters, or geometry, and apply fixed flow only when velocity and direction are measured or imposed by a controlled test. For board-to-chassis conduction, include interface thickness and contact resistance; perfect bonded contact usually makes the predicted path too optimistic. Model nearby heat sources when they raise inlet air or enclosure-wall temperature.

Use steady-state analysis for sustained operation and transient analysis for time-dependent limits. Warm-up time, pulses, duty cycle, thermal-protection timing, or a short mission profile can control the design. A board may fail a steady-state case it never reaches during a brief event, or pass steady state while exceeding a short component limit during a concentrated pulse. Transient accuracy requires density and specific heat in addition to conductivity, plus a time-dependent load profile and realistic initial temperature. Select time steps small enough to capture the fastest decision-relevant event, then verify that further step reduction does not materially change peak temperature or timing.

Which PCB Thermal Simulation Software Fits Each Model Fidelity?

Select software by required physics, geometry exchange, validation needs, and available expertise—not by a generic “best tool” label. Simple online tools support early screening, while electronics-cooling and multiphysics solvers handle detailed copper, airflow, Joule heating, and coupled thermal-mechanical questions. Before committing the workflow, verify the licensed modules, ECAD import path, supported package models, transient capability, automation interface, mesh controls, and result-export format. Run a small benchmark with known heat input and measured temperatures; tool familiarity cannot substitute for a controlled correlation case.

  • ST eDesignSuite PCB Thermal Simulator: useful for rapid online screening of supported power designs and board-level thermal behavior.
  • Ansys Icepak and Mechanical: suited to electronics cooling, trace mapping, airflow, transient heat transfer, and coupled reliability workflows.
  • Simcenter Flotherm or FLOEFD: suited to board, enclosure, airflow, and electronics-cooling studies with CAD-oriented workflows.
  • COMSOL Multiphysics: useful when custom equations or coupled electrical, thermal, fluid, and structural physics control the problem.
  • ECAD-integrated tools: useful for early layout screening, but capability varies by version, extension, and solver connection.
  • Open-source workflows: can support controlled research models, but geometry conversion, material data, verification, and support remain the user’s responsibility.

How to Run PCB Thermal Simulation: A Step-by-Step Workflow

A defensible workflow starts with the decision and ends with correlation against a physical board. Do not begin by importing every geometric feature. Define the target temperature, operating state, uncertainty, and pass criterion first, then add only the detail required to answer that question. Freeze input revisions before the baseline run, preserve solver settings between design variants, and record why each simplification is acceptable. This makes the final comparison reproducible and prevents a mesh, load, or boundary change from being mistaken for a design improvement.

  1. State the decision: identify the component limit, board region, operating case, and acceptance margin.
  2. Collect controlled inputs: freeze the BOM, stack-up, copper data, mechanical geometry, losses, and environment.
  3. Select model fidelity: choose lumped, orthotropic, trace-mapped, or locally detailed geometry.
  4. Assign materials and contacts: include directional board properties and non-ideal interfaces.
  5. Apply loads and boundaries: reconcile heat-source totals and represent airflow, gravity, openings, and walls.
  6. Mesh critical gradients: refine packages, vias, narrow copper necks, TIM layers, and flow restrictions.
  7. Run convergence checks: reduce mesh size or time step until decision metrics stabilize.
  8. Review energy balance: confirm generated heat equals heat leaving the solved system at steady state.
  9. Compare controlled variants: change one design factor at a time and preserve the baseline.
  10. Correlate on hardware: repeat the modeled load and environment, then update uncertain inputs transparently.

What Do Temperature, Heat-Flux and Airflow Results Mean?

Temperature, heat flux, and airflow answer different questions and must be interpreted together. Temperature shows whether a defined location approaches its limit, heat flux shows where energy crosses a surface, and airflow reveals how the fluid carries heat away. Review peaks, gradients, path continuity, and the locations of all maxima. A hot pixel at a sharp corner may be a mesh singularity; a broad hot region that persists through refinement is more likely real. Compare junction or case temperature against the correct datasheet limit and measurement location because surface temperature is not automatically junction temperature. Inspect vector direction and integrated heat flow through key interfaces to confirm that the path is physically plausible. For airflow, check recirculation, board bypass, blocked vents, and preheated inlet air instead of relying only on maximum velocity.

Why Do PCB Thermal Simulation Results Become Misleading?

Misleading results usually originate in the model definition, not the solver. The largest risks are understated power, perfect contacts, excessive airflow, incorrect copper fraction, missing neighboring heat sources, coarse mesh at thin layers, and validation measurements that do not reproduce the model. A visually smooth result can still be wrong by a decision-changing margin. Diagnose the error by checking energy balance first, then heat-source totals, interfaces, boundary conditions, mesh convergence, and measurement setup in that order. Change one uncertain input at a time and retain the failed baseline so the cause remains traceable.

  • False low temperature: caused by ideal heat-sink contact, excessive convection, or omitted losses.
  • False hotspot: caused by concentrated point sources, incorrect package resistance, or a local mesh artifact.
  • Wrong transient peak: caused by incorrect heat capacity, initial temperature, duty cycle, or time step.
  • Unstable comparison: caused by changing geometry, mesh, and boundary conditions at the same time.
  • Failed correlation: caused by unknown emissivity, thermocouple heat sinking, load mismatch, or uncontrolled airflow.

How Should Simulation Be Correlated with Prototype Measurements?

Correlation must reproduce the modeled locations, load, ambient, orientation, enclosure, airflow, and elapsed time. Use thermocouples for controlled point temperatures and infrared imaging for spatial patterns, while accounting for emissivity and reflections. Record electrical input and output so actual dissipation can be compared with the modeled source total. Calibrate uncertain inputs within physically justified ranges; do not tune unrelated values merely to match one point. A useful measurement set includes a primary hotspot, one heat-path location, one cool reference region, and transient warm-up data. If one calibration improves the hotspot but worsens every other point, the model structure or measurement setup is probably incomplete.

PCB thermal simulation validation with infrared imaging and contact temperature measurements

Which PCB Design Changes Should Be Re-Simulated Before Release?

Re-run the affected model whenever a revision changes heat generation, spreading, contact resistance, or cooling. Preserve the released baseline and compare decision metrics under identical conditions. A small layout edit can be thermally significant when it cuts a copper neck, moves a via field, shifts a hot device upstream in the airflow, or changes chassis contact. Classify each revision by the thermal path it changes, update only the affected inputs, and repeat convergence and correlation checks when the revision invalidates their assumptions. Record unchanged controls so reviewers can distinguish a real improvement from a different simulation setup.

  • Power or BOM change: recalculate losses and package thermal data.
  • Stack-up or copper change: rebuild directional properties or trace mapping.
  • Via change: update barrel geometry, connections, fill, and receiving planes.
  • Enclosure or fan change: update flow resistance, fan curve, openings, and inlet temperature.
  • TIM or mounting change: update thickness, compression, contact area, and interface resistance.
  • Conformal coating or potting: add the material only with grade-specific thermal properties and actual coverage.

What Evidence Should Accompany a Thermal-Ready PCB Package?

A thermal-ready release package must preserve the modeled geometry and make the decision reproducible. Include fabrication data, controlled stack-up, copper weights, via construction, material grades, component orientation, mechanical contacts, interface requirements, and the operating load case. Separate calculated assumptions from measured inputs. For build review, submit Gerber or ODB++, drill data, BOM, pick-and-place, stack-up, assembly drawings, enclosure or heat-sink drawings, target quantity, and test requirements. Add a model summary containing the solver version, convergence evidence, boundary conditions, heat-source table, critical temperatures, validation setup, measured-versus-predicted differences, and remaining uncertainty.

FAQs About PCB Thermal Simulation

Q1: What is a thermal analysis for PCB?

A1: It is a calculation or simulation that estimates board, component, and airflow temperatures for a defined load and environment. The result applies only to the modeled operating case. Use it to compare design options and identify heat-path risks, then correlate critical temperatures on representative hardware before release.

Q2: How to calculate PCB thermal resistance?

A2: Divide the temperature rise between two defined locations by the steady heat flow through that path, using Rθ = ΔT / Q. State the two temperature locations, heat-flow direction, boundary conditions, and units. A board-level value is not interchangeable with a package θJA value measured under standardized conditions.

Q3: What are the thermal properties of PCB?

A3: The main properties are directional thermal conductivity, density, specific heat, emissivity, and interface resistance. Use values for the released stack-up and material grades. Copper coverage makes in-plane conductivity different from through-thickness conductivity, so one generic isotropic value can distort spreading and warm-up behavior.

Q4: Is free PCB thermal simulation accurate enough for release decisions?

A4: Free software can support screening when its physics and geometry match the question, but price does not determine accuracy. Check board anisotropy, copper representation, convection, transient loads, mesh control, and result export. An uncorrelated model should compare options, not serve as production-release evidence.

Q5: Is PCB thermal simulation software free, and what limits should be checked?

A5: Some online, open-source, vendor, and trial tools are free within defined limits. Check licensing and solver capability before building the workflow. Restrictions may apply to supported devices, node count, ECAD import, coupled physics, automation, commercial use, or exportable results.

Q6: Can PCB thermal simulation online replace a detailed solver?

A6: Online tools are useful for fast screening when their supported topology and assumptions match the board. They cannot replace geometry and physics they do not model. Use a detailed solver or physical test when copper paths, enclosure airflow, contact resistance, transient loads, or neighboring heat sources control the decision.

Q7: What should be checked in a KiCad PCB thermal simulation workflow?

A7: Verify units, board outline, copper layers, drill and via geometry, component coordinates, package heights, and the exported 3D assembly. A successful import does not prove thermal completeness. Material properties, losses, contacts, airflow, and boundary conditions still have to be assigned and checked independently.

Q8: When should Ansys PCB thermal simulation be used?

A8: It is appropriate when the decision requires detailed electronics cooling, trace or layer mapping, enclosure airflow, transient behavior, Joule heating, or coupled structural analysis. Confirm the licensed modules and ECAD exchange path first. Validate the workflow with a known heat input and measured temperatures before relying on a complex production model.

Q9: What should be verified in an Altium PCB thermal simulation workflow?

A9: Confirm which analysis extension or connected solver is being used, because capability depends on the installed version and workflow. Verify transferred stack-up, copper, component, and power data. Treat early layout indicators as screening evidence unless the thermal model also includes realistic materials, contacts, environment, convergence checks, and hardware correlation.

Q10: Can SolidWorks PCB thermal simulation model enclosure airflow?

A10: A supported SolidWorks thermal or flow workflow can represent board geometry, enclosure airflow, fans, heat sinks, and mechanical contacts when the necessary modules and data exchange are available. Verify fan curves, vent resistance, contact interfaces, and imported copper detail. Use measured airflow and temperature data to confirm the assembled model.

Conclusion

PCB thermal simulation is decision-ready only when the model and prototype describe the same operating case. Choose the simplest fidelity that resolves the risk, preserve the heat-source and boundary-condition evidence, test uncertainty explicitly, and correlate critical temperatures before release. Keep the model revision, convergence record, and measured comparison with the fabrication package so later power, stack-up, copper, via, enclosure, or cooling changes can be evaluated against the same baseline.

For a PCB manufacturing and thermal-readiness review, send the controlled Gerber or ODB++, BOM, stack-up, material requirements, mechanical interface drawings, operating load cases, and thermal test plan to sales@bestpcbs.com.

2026 PCB Raw Material Price Increase: CCL, Prepreg and Copper Foil Timeline

August 4th, 2026

The PCB raw material price increase in 2026 is real, but it is not one continuous rise across every board type. Resonac and Panasonic announced large CCL and prepreg revisions during the year, while an August PCB-pricing update showed that temporary surcharges for some standard FR4 volume orders could also be removed when conditions eased.

For PCB buyers, the useful question is not “How much did all boards rise?” It is “Which material, supplier notice, effective date, stackup, copper weight, and order size apply to this quotation?” This timeline separates those factors and explains why raw-material percentages cannot be copied directly into a finished-board price.

PCB Raw Material Price Increase with CCL, prepreg and copper foil

What Changed in the PCB Materials Market in 2026?

PCB material suppliers responded to higher copper foil, glass cloth, resin, solvent, energy, labor, and logistics costs with multiple product-specific price notices. The timing and scope differed by supplier: one notice covered all CCL and prepreg products, while others separated general glass-epoxy, low-loss, substrate, CEM-3, and flexible materials.

That distinction matters because a PCB quotation does not buy “raw material” as one commodity. It buys a defined construction using selected laminate and prepreg systems, copper weights, finished thickness, layer count, panel area, and process controls.

2026 Copper Clad Laminate Price Trend and Notice Timeline

The 2026 copper clad laminate price trend is best understood as a sequence of supplier notices followed by a partial easing signal in one standard-FR4 market segment. The percentages below are separate adjustments to different suppliers’ own products and base prices; they must not be added together.

Notice / Effective Date Product Scope Reported Change
Resonac: Jan 16 / Mar 1 All CCL and prepreg products 30% or more
Panasonic: Apr 9 / May 1 General CCL / prepreg +30% / +20%
Panasonic: Apr 9 / May 1 Low-loss CCL / prepreg +20% / +15%
Panasonic: Apr 9 / May 1 CEM-3 / FCCL +30% / +15%
JLCPCB: Jun 13 / Jun 26 FR4, FPC, aluminum, copper, Rogers and Teflon substrates Dynamic pricing; no single percentage stated
Panasonic: Jun 26 / Aug 1 General CCL / prepreg +20% / +25%
Panasonic: Jun 26 / Aug 1 Low-loss CCL / prepreg +10% / +15%
Panasonic: Jun 26 / Aug 1 LEXCM GX CCL / prepreg +5% / +5%
Panasonic: Jun 26 / Aug 1 CEM-3 / FCCL +20% / +15%
JLCPCB: Aug 3 Standard 1-, 2-, and 4-layer FR4 volume orders Temporary tiered surcharges removed

The earlier copper clad laminate price guide explains the material and board-cost relationship in general. This article focuses on the dated 2026 market events.

2026 timeline represented by CCL sheets, prepreg rolls and copper foil

Why Are CCL and Prepreg Prices Rising?

CCL and prepreg prices are rising because several input costs increased at the same time and supply tightened for key materials. Resonac specifically cited copper foil and glass-cloth constraints plus higher labor and transportation costs. Panasonic’s April notice cited raw materials, energy, and logistics, while its June notice added pressure from petroleum-derived resins, solvents, related materials, and international logistics.

  • Copper foil: affects every copper-clad sheet and becomes more important with heavier copper.
  • Glass cloth: provides reinforcement and influences thickness, dimensional stability, and electrical performance.
  • Resin and solvents: affect laminate and prepreg production, especially controlled resin-content systems.
  • Energy and labor: influence material production, lamination, treatment, and handling.
  • Logistics: affects both raw inputs and finished laminate movement across regions.

What Did Panasonic’s Two 2026 Price Revisions Show?

Panasonic’s April and June notices show that the cost pressure persisted but did not affect every material family equally. The May-effective notice applied a larger increase to general CCL than to general prepreg, while the August-effective notice reversed that relationship: general prepreg received the larger percentage adjustment.

Low-loss materials, substrate materials, CEM-3, and FCCL also had separate rates. This is why a buyer should provide the exact laminate system or electrical requirement instead of asking for a generic “FR4 price.” Our PCB material guide outlines the performance differences that drive material selection.

How Does a Copper Clad Laminate Price Increase Affect PCB Cost?

A copper clad laminate price increase affects the material portion of a PCB quotation, but the finished-board impact depends on how much laminate the design consumes and how efficiently it panels. Layer count, board area, core thickness, laminate grade, copper weight, stackup yield, and order quantity all change the result.

Design Factor Why Exposure Changes
Board area and panel utilization More laminate area or poorer nesting increases material consumed per board
Layer count More cores and prepreg interfaces increase laminate-system usage
Copper weight Heavier copper raises copper content and may change process requirements
Material grade Low-loss, high-Tg, halogen-free and high-frequency systems have different price bases
Finished thickness and stackup Changes core/prepreg selection and the amount of resin and glass used
Inventory and quotation date Existing stock may temporarily buffer a notice; replacement stock may use a new base price

How Does a Prepreg Price Increase Affect PCB Stackups?

A prepreg price increase affects multilayer boards through bonding-layer count, glass style, resin content, pressed thickness, flow behavior, and the selected material family. For a prepreg price increase PCB cost review, the stackup and number of bonding interfaces matter more than the finished board outline alone.

Prepreg cannot be replaced solely on price. The change can affect dielectric thickness, impedance, resin fill around copper, lamination flow, thermal performance, and qualification status. See our guide to prepreg and core in PCB stackups for the structural difference.

What Does Copper Foil Price Pressure Mean for PCBs?

Copper foil price pressure matters because foil is both a CCL input and a direct cost driver for copper-intensive constructions. The verified Resonac notice identified tight copper-foil supply and higher prices as part of its CCL/prepreg revision background. It did not state one universal copper-foil percentage that could be applied to all boards.

A copper foil price increase usually matters more to heavy-copper boards, large panels, high-layer-count designs, and constructions with high copper utilization. Surface treatment, etching difficulty, plating requirements, and yield still affect the final quotation independently of commodity or foil input prices.

CCL panels, prepreg sheets and copper foil used in PCB production

Why Did Standard FR4 Pricing Ease While Special Materials Stayed Exposed?

Standard FR4 pricing eased in one large-order channel because material and component conditions improved enough for temporary volume surcharges to be removed. JLCPCB’s August 3 notice applied specifically to standard 1-, 2-, and 4-layer FR4 volume orders; it did not state that all laminate suppliers reversed their notices or that every special material became cheaper.

Standard FR4 has a broader supplier base and more substitution flexibility than many controlled low-loss, high-frequency, FPC, metal-core, or customer-approved systems. Our FR4 PCB material guide explains why even the term FR4 covers multiple grades and performance levels.

Which PCB Designs Are Most Exposed to Material Volatility?

Designs are most exposed when they consume more material, require a narrow approved material set, or cannot switch suppliers without new electrical or reliability validation. The following projects deserve earlier material confirmation:

  • high-layer-count multilayer boards with many prepreg interfaces;
  • large panels or low panel-utilization designs;
  • heavy-copper and metal-core constructions;
  • low-loss, high-frequency, PTFE, Rogers, or controlled-Dk/Df designs;
  • flex and rigid-flex boards using specified FCCL and coverlay systems;
  • automotive, medical, aerospace, or other controlled builds with restricted substitutions;
  • repeat orders whose old price was based on inventory purchased before a supplier notice.

For low-loss projects, supplier qualification must protect electrical performance as well as availability. Our low-loss PCB supplier guide lists practical checks for materials, stackups, impedance, and production control.

How Should PCB Buyers Plan Quotes and Orders in 2026?

PCB buyers should request construction-specific quotes, confirm material availability, and align quote validity with the planned purchase date. The goal is to reduce surprises without freezing an unverified design or over-ordering material.

  • Provide Gerber or ODB++, stackup, finished thickness, copper weight, material grade, quantity, and delivery schedule.
  • State whether an equivalent laminate system is allowed and who must approve it.
  • Ask whether the quote uses current inventory, replacement-stock pricing, or a supplier allocation.
  • Confirm quote validity and recheck long-lead or special materials before releasing the PO.
  • Separate prototype pricing from volume pricing; their material utilization and surcharge rules may differ.
  • Do not use one supplier notice as a blanket percentage for every line of a PCB or PCBA quote.

Because the PCB raw material price increase differs by material family and quotation date, repeat orders should be rechecked against the approved stackup rather than compared only with an old unit price.

Engineering and procurement review of PCB stackup and material quotation

FAQ About the 2026 PCB Material Price Increase

Did all PCB raw materials rise by 30% in 2026?

No. Some supplier notices used 30% or more for defined product groups, while others used lower rates or dynamic pricing. The rates apply to specified suppliers, products, dates, and base prices.

Can the supplier percentages be added together?

No. They are separate notices for different suppliers and effective dates. Even two notices from the same supplier may apply to different current price bases, so adding the percentages would misrepresent the published information.

Does a 30% CCL increase make the finished PCB 30% more expensive?

Not necessarily. CCL is one part of finished-board cost. The actual effect depends on laminate usage, panel efficiency, layers, copper, drilling, imaging, plating, testing, yield, quantity, and inventory.

Why can standard FR4 pricing fall while low-loss materials remain high?

Standard FR4 usually has broader supply and greater substitution flexibility. Low-loss and specialty systems may have fewer qualified sources, tighter specifications, and longer validation cycles.

Which date matters: the notice date or the effective date?

The effective date normally determines which shipments or orders use the revised supplier price. Existing inventory, contracts, and regional terms can still affect when a PCB quotation changes.

Why does prepreg pricing matter for multilayer boards?

Prepreg bonds layers and controls dielectric thickness and resin fill. Multilayer boards use multiple prepreg interfaces, so material choice and layer count can increase exposure.

Are copper prices and copper foil prices the same?

No. Copper foil includes conversion, treatment, thickness, quality, supply, and contract factors beyond the underlying metal price. A commodity move cannot be copied directly into a foil or PCB percentage.

Should buyers change laminate brands to save cost?

Only after confirming electrical, thermal, mechanical, regulatory, and customer requirements. A cheaper laminate is not equivalent if it changes impedance, loss, reliability, processing, or qualification status.

How long should a PCB price quote remain valid?

There is no universal period during volatile conditions. Buyers should use the validity printed on the current quotation and re-confirm material availability before a delayed purchase order.

What files help a manufacturer assess material cost accurately?

Provide fabrication data, stackup, board dimensions, finished thickness, copper weights, material grade, quantity, panel constraints, test requirements, and delivery schedule.

Market data note: this article uses issuer notices dated January 16, April 9, June 13, June 26, and August 3, 2026. A circulated July laminate notice was excluded from the quantified timeline because the original issuer document was not available for verification.

How Can EBest Circuit Review Your PCB Material and Quote Risk?

At EBest Circuit, we can review your Gerber files, stackup, material specification, copper weight, quantities, and delivery plan together before quoting. Send the project package to sales@bestpcbs.com for material-availability review and a current PCB or PCBA quotation.

MLCC Shortage 2026: Why Prices Are Rising and How to Protect Your BOM

August 4th, 2026

MLCC shortage 2026 data shows a split market: AI-oriented high-capacitance parts are absorbing premium capacity, while some mainstream consumer MLCC inventories have fallen below 30 days. TrendForce reported average distributor increases of 20%–25% in late July and spot prices as high as two to three times previous levels for some parts.

Those figures do not mean every MLCC, purchase contract, or PCBA quotation has risen by the same percentage. They describe different parts and channels at specific dates. Buyers need to identify exposed BOM lines, verify alternatives electrically and mechanically, and confirm current availability before releasing a production order.

MLCC Shortage 2026 with ceramic capacitors on a populated PCB

What Is Driving the MLCC Shortage in 2026?

The shortage is being driven by specification concentration, capacity reallocation, channel stocking, and limited near-term expansion rather than by uniform demand growth across all electronics. AI accelerator boards require large numbers of small, high-capacitance capacitors for decoupling, filtering, and power integrity. Suppliers are therefore prioritizing difficult, higher-value X6S and X7R products.

This change reduces the production flexibility available for some consumer X5R parts. At the same time, distributors and customers are ordering earlier to protect second-half production, which can amplify apparent demand. The result is an unusual market in which end demand for some consumer electronics remains weak while channel prices for selected MLCCs rise.

  • AI demand: custom ASIC and accelerator platforms consume many high-capacitance, low-voltage MLCCs.
  • Capacity shift: production resources move from standard consumer specifications toward higher-end AI parts.
  • Manufacturing constraints: advanced small-package, high-capacitance parts are difficult to produce at high yield.
  • Preventive buying: early orders and channel stockpiling increase short-term pressure and the risk of duplicate demand.

Which MLCC Types Are Under the Most Pressure?

The clearest pressure is in high-capacitance, low-voltage, miniature MLCCs used by AI platforms and in selected consumer X5R values affected by the same capacity shift. TrendForce identified mainstream consumer parts from 1 µF to 22 µF with inventory below 30 days in late July, while certain high-capacitance X6S lead times had already extended from eight to as long as twenty weeks in June.

Segment 2026 Signal BOM Concern
High-capacitance X6S/X7R for AI Strong demand, difficult production and longer lead times Limited qualified sources and spot premiums
Consumer X5R, 1 µF–22 µF Mainstream inventory reported below 30 days Capacity spillover and channel price volatility
Automotive-grade parts Price adjustments reported for some ranges Qualification requirements restrict substitutions
Other standard MLCCs Availability varies by maker, package and value Do not assume a market-wide shortage without checking the exact MPN

For a refresher on dielectric classes, package sizes, values, and common manufacturers, see our MLCC capacitor guide. The relevant shortage risk always belongs to an exact manufacturer part number and approved specification, not to the word “capacitor” alone. MLCC capacitors with the same nominal value can still differ in dielectric, DC-bias behavior, termination, temperature range, and qualification level.

MLCC Price Increase in 2026: What Changed From April to July?

The reported MLCC price increase developed in stages, but the percentages are not cumulative because they cover different product groups and channels. TrendForce reported a 6%–13% adjustment for selected consumer low-capacitance and automotive parts in April, 15%–25% average increases for mainstream X5R distributor prices in China in June, and 20%–25% average distributor increases for affected consumer-grade products in late July.

Date Reported Change Scope
April 2026 6%–13% Selected consumer low-capacitance and automotive MLCCs from one major supplier
June 2026 15%–25% average Mainstream consumer X5R pricing through distributors in China
Late July 2026 20%–25% average Affected distributor-held consumer-grade MLCCs
Late July 2026 2–3× previous price Some urgent spot-market transactions, not general contract pricing

A spot-market premium can change quickly and may reflect a specific date code, package, maker, quantity, or delivery requirement. It should not be used as a universal multiplier for every MLCC or for an entire assembly quotation.

An MLCC capacitor price is therefore meaningful only when the manufacturer part number, authorized source, quantity, date code, packaging, inventory ownership, and quotation validity are known. A low online unit price and an urgent traceable production lot are not equivalent offers.

Reels of MLCC components and a procurement timeline on an electronics workbench

Why Is AI Demand Redirecting MLCC Capacity?

AI hardware concentrates demand on a limited set of MLCC specifications that must deliver high effective capacitance in a small area under demanding temperature and power conditions. That requirement is difficult to meet simply by running more standard capacitors through an existing line.

TrendForce cited one accelerator design in which the use of 47 µF, 2.5 V, X6S, 0402 capacitors increased from 1,440 to 10,544 pieces per board. Another platform increased its use of 100 µF, 4 V, X6S, 0805 parts from 320 to 500 pieces. These examples show why a small number of advanced specifications can absorb substantial effective capacity even when the broader electronics market is not booming.

New capacity also takes time to qualify and ramp. High-layer-count ceramic structures, thin dielectric layers, electrode alignment, termination quality, and yield all affect usable output. A factory expansion announcement therefore does not create immediately available qualified parts.

How Can the MLCC Supply Shortage Affect a PCBA BOM?

An MLCC supply shortage affects a PCBA BOM through line-item availability, quote validity, substitution workload, and schedule risk rather than through one fixed assembly-price formula. A low-cost capacitor can still stop a build if it is used many times, has only one approved source, or performs a critical power-integrity function.

  • Allocation risk: the quoted quantity may disappear before the purchase order is released.
  • Short quote validity: distributors may confirm price and stock for a limited period.
  • Partial-kitting risk: one unavailable MPN can hold an otherwise complete kit.
  • Engineering delay: a replacement may require electrical review, sample assembly, and functional testing.
  • Cash and inventory trade-off: early buying protects supply but increases working capital and excess-stock exposure.

The impact on a PCBA price depends on how many affected parts are used, the order quantity, the approved manufacturer list, the sourcing channel, and whether redesign or validation is required. MLCC market percentages must never be transferred directly to the total assembly price.

Which Specifications Must Match Before Approving an Alternate?

An alternate MLCC must match the circuit’s real electrical, environmental, mechanical, and qualification requirements—not just capacitance and case size. The same nominal value can behave very differently under DC bias, temperature, frequency, board flex, and reflow stress.

MLCC capacitor voltage derating cannot be checked from the printed voltage rating alone. Engineers should compare effective capacitance at the actual DC operating voltage and temperature, then confirm that the remaining capacitance still satisfies the circuit’s transient, filtering, and stability requirements.

Check Why It Matters Evidence to Review
Capacitance and tolerance Sets the nominal range before operating effects Part number and datasheet limits
Rated voltage and DC bias Effective capacitance may fall sharply under applied voltage DC-bias or capacitance-change curve
Dielectric and temperature range X5R, X6S, X7R and C0G/NP0 are not interchangeable by default Temperature characteristic and application conditions
Package and termination Affects footprint fit, solder joint geometry and flex-crack risk Dimension drawing and termination construction
Impedance, ESR and ESL Changes filtering, transient response and power integrity Frequency curves and circuit simulation
Qualification level Automotive, medical, safety or customer-controlled BOMs may restrict changes Required qualification and customer approval records

Our guide to selecting SMD electronic components explains how package, rating, environment, assembly process, and availability should be reviewed together.

Engineer comparing MLCC datasheets and measuring a populated PCB

How Should Engineering Teams Validate MLCC Substitutions?

Engineering teams should validate the replacement at part, board, and system levels before changing a controlled BOM. A distributor’s “cross” result is a sourcing lead, not automatic design approval.

Relevant MLCC capacitor failure modes include flex cracking, thermal-mechanical cracking, insulation-resistance degradation, and short-circuit failure. Package construction, termination type, land pattern, board strain, depaneling, and reflow conditions can therefore matter as much as the nominal electrical value.

  1. Compare manufacturer data: check capacitance, tolerance, rated voltage, dielectric, temperature, dimensions, termination, and reliability class.
  2. Check operating-point performance: compare effective capacitance under the board’s DC voltage and expected temperature.
  3. Review circuit function: assess impedance, ESR, ESL, ripple, transient response, and any timing or signal-path dependency.
  4. Confirm PCB compatibility: verify land pattern, component height, spacing, stencil design, and pick-and-place data.
  5. Build controlled samples: use the intended assembly profile and inspect solder joints for placement or wetting problems.
  6. Run functional tests: repeat the tests most sensitive to the capacitor’s role, including power-rail noise, startup, load transient, thermal, or environmental tests where applicable.
  7. Control the revision: document the approved MPN, test evidence, date code requirements, and customer approval if required.

If a preferred MPN is unavailable, our article on alternative electronic components provides a broader framework for AVL control and PCBA change review.

What Procurement Actions Can Reduce MLCC Shortage Risk?

Procurement teams can reduce risk by acting earlier on the exact exposed MPNs while avoiding panic buying across the whole passive BOM. The objective is controlled coverage, not unlimited inventory.

  • Classify MLCC lines by usage quantity, approved-source count, current lead time, and circuit criticality.
  • Ask for manufacturer-authorized or otherwise traceable supply before accepting an unfamiliar channel.
  • Confirm stock ownership, date code, packaging, minimum order quantity, price validity, and shipment schedule in writing.
  • Request engineering review of alternates before the preferred part becomes unavailable.
  • Reserve supply against a realistic production forecast and define cancellation or excess-inventory responsibility.
  • Avoid duplicate orders across multiple suppliers unless allocation and cancellation rules are controlled.

EBest Circuit’s component sourcing service can be used alongside PCB assembly planning so BOM availability, assembly requirements, and production timing are reviewed in the same project context.

What Should a PCBA RFQ Include During an MLCC Shortage?

A useful PCBA RFQ should make both the technical requirement and the sourcing flexibility explicit. This allows the assembler to quote the intended design and identify supply risks without making unauthorized substitutions.

  • Complete BOM with manufacturer and exact MPN for every MLCC.
  • Approved alternate MPNs or an approved manufacturer list, if available.
  • Gerber or ODB++ data, centroid file, assembly drawing, and schematic.
  • Prototype and production quantities plus required delivery dates.
  • Customer-supplied, pre-purchased, or consigned component information.
  • Any automotive, medical, traceability, date-code, or change-approval requirement.
  • Required functional test, programming, inspection, and acceptance criteria.

These files also help align component decisions with the complete PCBA manufacturing process, including SMT preparation, placement, reflow, inspection, testing, and final build control.

PCBA sourcing team reviewing MLCC lines in a bill of materials

What Does the Rest of 2026 Look Like for MLCC Supply?

The second half of 2026 remains exposed to longer lead times and further pricing pressure in selected high-end and spillover consumer specifications, but a universal shortage is not inevitable. TrendForce identified the fourth quarter as an important point for judging whether high-end tightness becomes a full shortage.

Buyers should watch manufacturer lead times, distributor inventory, book-to-bill ratios, allocation notices, price validity, and whether new capacity produces qualified output. The MLCC shortage 2026 should therefore be managed as a part-number-level risk with frequent BOM checks, not as a reason to assume every capacitor will remain unavailable or expensive.

FAQ About the MLCC Capacitor Shortage

Is there really an MLCC shortage in 2026?

Yes, supply risk is real for selected high-end, high-capacitance, low-voltage MLCCs and for some consumer X5R values affected by capacity reallocation. The market is polarized, however, so availability must be checked by exact MPN rather than treating every MLCC as constrained.

Which MLCC values have the tightest inventory?

TrendForce reported mainstream consumer mid/high-capacitance inventory in the 1 µF–22 µF range below 30 days in late July. Advanced AI specifications such as small-package, high-capacitance X6S parts also showed extended lead times.

How much did MLCC prices increase in 2026?

Reported changes varied by date and channel: 6%–13% for selected parts in April, 15%–25% average distributor increases for mainstream X5R in June, and 20%–25% average increases for affected distributor inventory in late July. Some urgent spot transactions reached two to three times previous prices, but that was not a universal contract-price change.

Why does AI use so many MLCCs?

AI accelerators have dense, fast-changing power loads. Large MLCC arrays provide local energy storage, decoupling, filtering, and low-impedance current paths close to processors and power-delivery circuits.

Are X5R and X7R capacitors interchangeable?

Not automatically. Their temperature characteristics differ, and effective capacitance also depends on voltage, package, manufacturer construction, and circuit conditions. The replacement must be checked against the design’s operating limits and test requirements.

Can I use a higher-voltage MLCC as an alternate?

Sometimes, but only after checking case size, effective capacitance under DC bias, impedance, termination, fit, and qualification requirements. A higher printed voltage rating alone does not prove equivalence.

Does an MLCC price increase raise the total PCBA price by the same percentage?

No. Total PCBA cost includes the complete BOM, PCB fabrication, assembly, testing, quantity, yield, logistics, and other services. The effect depends on how many affected MLCCs are used and which sourcing route is available.

Should buyers stockpile MLCCs now?

Buyers should secure realistic coverage for verified at-risk MPNs, not buy every passive component indiscriminately. Excess stock can create cash, storage, cancellation, and obsolescence risk if demand or pricing changes.

How can counterfeit or relabeled MLCC risk be reduced?

Prefer traceable supply, verify packaging and labels, retain receiving records, and use incoming inspection appropriate to the project risk. Urgent spot buying should not bypass supplier qualification or change control.

When should a PCBA buyer approve alternate MLCCs?

Approve alternates before the preferred MPN becomes a production blocker. Engineering should review datasheets and operating curves, assemble samples when needed, run relevant functional tests, and document the controlled BOM change.

Market data note: price, inventory, shipment, book-to-bill, and lead-time figures in this article are attributed to TrendForce releases dated May 18, June 17, July 6, and July 28, 2026. Market conditions vary by manufacturer part number, quantity, channel, region, and quotation date.

How Can EBest Circuit Help Protect Your PCBA Schedule?

At EBest Circuit, we can review your Gerber files, BOM, approved alternates, quantities, and delivery requirements together so exposed MLCC lines are identified before production. For component sourcing and PCB assembly support, send your project files to sales@bestpcbs.com for technical review and a current quotation.

PCB Thermal Cycling Test: Methods, Profiles, and Failure Analysis

August 4th, 2026

A PCB thermal cycling test repeatedly exposes a board, coupon, or assembly to controlled high and low temperatures to reveal fatigue in vias, plated holes, laminate interfaces, and solder joints. A useful result depends on more than chamber setpoints. The test plan must define specimen temperature, dwell, ramp or transfer time, cycle count, electrical monitoring, failure criteria, and the analysis used to confirm where damage occurred.

This guide explains how to define a reproducible profile, select the right specimen and method, capture intermittent resistance events, and connect an electrical symptom to a physical failure. Board-level, solder-attachment, and component methods remain separate because one profile cannot answer every reliability question.

PCB thermal cycling test chamber with a board coupon and monitored assembly

What Is a PCB Thermal Cycling Test?

Temperature cycling repeatedly moves a specimen between controlled extremes to accelerate thermal-fatigue damage. The chamber creates the environment, but the specimen design and measurement circuit determine which interconnects are stressed and which failures can be detected.

The test is normally comparative or qualification-oriented. It can show whether one via construction, material set, solder attachment, or process condition survives a defined profile better than another. It does not prove field life by itself. A life prediction also needs a defensible acceleration model, a matching failure mechanism, and service conditions that are represented by the laboratory profile.

Define the decision before choosing the chamber profile. A development test may compare constructions until their performance separates. A qualification test applies a predetermined exposure and acceptance rule. Screening instead removes anomalous units without consuming a meaningful portion of expected fatigue life. Mixing these objectives produces precise-looking data that may not answer the original question.

  • Test object: Use a bare-board coupon when the question concerns plated-through holes, blind or buried vias, or internal interconnects. Use an assembled board when solder joints, packages, underfill, connectors, component terminations, or assembly thermal history are part of the risk. The specimen must contain the structure whose failure will change the decision.
  • Measured response: Continuous resistance can reveal short intermittent opens; periodic resistance can document permanent drift; insulation resistance or leakage addresses isolation; warpage measurements address dimensional response; and microsections locate physical separation. Choose measurements from the expected failure mechanism rather than collecting unrelated data.
  • Decision boundary: The drawing, test method, qualification plan, or contract must define the exposure, sample count, acceptable events, stop rule, and disposition. Without a prewritten boundary, a late change to the pass criterion can turn exploratory observations into an unsupported acceptance claim.

How Does Thermal Cycling Stress PCB Interconnects?

Coefficient-of-thermal-expansion mismatch converts each temperature excursion into cyclic strain. Copper, resin, glass reinforcement, solder, component bodies, and terminations do not expand at identical rates, so repetition can initiate a small crack, extend it, and eventually create a stable or intermittent open circuit.

For plated holes and vias, the through-thickness expansion of the laminate can load the copper barrel and its junction with an internal pad. For surface-mount assemblies, package-to-board expansion mismatch loads the solder attachment. Large packages, stiff terminations, high local strain, and long distances from the neutral point can increase the mechanical demand, but the dominant mechanism must be confirmed rather than assumed.

  • Barrel fatigue: Cyclic axial strain can concentrate in the plated copper barrel or near the barrel-to-pad junction. The first electrical symptom may be a small temperature-dependent resistance shift rather than a permanent open. Confirm the suspected location by mapping the daisy-chain segment and preparing a microsection through the relevant plane.
  • Pad or corner separation: Local geometry, resin condition, copper distribution, drill quality, and prior processing can concentrate stress around an internal pad or hole corner. Review whether the separation is isolated to one layer, repeated at similar interfaces, or associated with another feature before assigning the cause.
  • Solder fatigue: Package-to-board expansion mismatch produces cyclic shear strain in solder attachments. Package size, stand-off height, joint geometry, alloy, reflow history, underfill, and distance from the neutral point change the strain distribution. Section location and crack path are needed to distinguish solder fatigue from pad or laminate damage.
  • Intermittent behavior: A partially separated conductor may open near one temperature extreme and reconnect as the assembly contracts or expands. Ambient-only checks can therefore report a normal value after a real in-cycle event. Correlate channel resistance with specimen temperature and event duration before classifying the failure.

Which PCB Thermal Cycling Test Conditions Must Be Defined?

A valid profile must define the specimen exposure, not only two chamber setpoints. The specimen may lag behind the chamber air, and two chambers with identical setpoints can impose different strain rates. Record the variables below before testing begins.

Variable Required definition Why it matters
Low and high temperature Setpoints and allowed tolerance in °C Defines the thermal excursion and material state
Specimen dwell Time after the monitored specimen reaches the required zone Prevents chamber-air time from being mistaken for board soak
Ramp or transfer Temperature-change rate in °C/min or transfer time in seconds Changes strain rate and distinguishes cycling from shock
Cycle count Planned cycles, inspection intervals, and stop rule Sets the exposure and reporting checkpoints
Electrical state Unpowered, biased, or current-induced heating Changes both the method and possible failure mechanisms
Monitoring Channels, sample rate, threshold, and event duration Determines whether short intermittent opens are captured

A first-pass cycle-time estimate is total time ≈ cycle count × (heating transition + high-temperature dwell + cooling transition + low-temperature dwell) + inspection and interruption time. For example, 500 cycles with two 15-minute transitions and two 20-minute dwells require about 583 chamber hours before inspections or interruptions. Use verified specimen dwell, not programmed chamber-air dwell, in the estimate.

Place thermocouples on representative high-mass and low-mass specimens during profile development. If the largest board reaches the dwell zone several minutes after the chamber sensor, the specified dwell should begin from the specimen criterion when the method requires specimen stabilization. Record overshoot, recovery after door openings, load arrangement, and any channel that did not remain inside tolerance; otherwise nominally identical cycle counts may represent different exposures.

Do not copy a popular temperature range into a new plan without checking the applicable method. Values such as −40°C to 125°C or −55°C to 125°C appear in some qualification contexts, but they are examples, not a universal PCB requirement. Material limits, component ratings, intended service, and the selected standard must remain compatible.

PCB Thermal Cycling vs Thermal Shock: What Changes?

The decisive difference is specimen transition rate: thermal shock changes temperature much faster than thermal cycling. A dual-chamber or liquid-to-liquid transfer can impose a steep gradient before the specimen reaches equilibrium, whereas thermal cycling generally uses a controlled ramp or slower air transition.

A fast transfer can activate different stress concentrations. Report the specimen response, not just the chamber command. Attach thermocouples at representative locations without creating an artificial heat path or mechanically restraining the sample. The broader relationship among cyclic exposure, thermal shock, and board-level defects is covered in the thermal stress test for PCB guide.

  • Choose cycling: Use controlled ramping when the invoked method, service model, or comparison plan depends on repeated heating and cooling with defined dwells. Verify that the specimen reaches the required zones and that the ramp does not exceed component, material, or fixture limits.
  • Choose shock: Use rapid transfer only when the requirement treats transition speed or steep internal gradients as part of the stress. State the transfer medium, transfer time, specimen loading, and dwell reference because an air-to-air result is not automatically equivalent to a liquid-medium result.
  • Avoid substitution: A pass from one method cannot be converted into a pass for the other by matching only the high and low temperatures. Transition rate, internal gradients, stabilization, moisture behavior, and dominant failure location may all change.

Which IPC and JEDEC Test Methods Apply?

Select the method from the specimen and failure mechanism being evaluated. A bare-board interconnect evaluation is not interchangeable with a surface-mount solder-joint fatigue study or a component qualification test.

Document Primary scope Important boundary
IPC-TM-650 2.6.6 Repeated temperature extremes for printed-board material or board structures Use the invoked revision and associated specification; do not invent acceptance criteria
IPC-TM-650 2.6.26 DC-current-induced thermal cycling of test structures Current heating and cycles-to-failure are part of this method concept
IPC-9701B Fatigue-life characterization of surface-mount solder attachments It addresses assembly attachments, not every bare-board defect
JESD22-A104 Temperature cycling of packaged solid-state devices It is not a complete bare-PCB acceptance specification

Record the document number, revision, condition, deviations, and acceptance source in the test plan. The phrase “tested to IPC” is too vague to reproduce the work or judge the result. For a broader map of bare-board, assembly, functional, and reliability methods, review the PCB testing guide.

Method selection should follow a traceable chain: identify the structure at risk, select the document that covers the specimen, choose the specified condition, and obtain acceptance criteria from the controlling product specification or qualification plan. A test method can define the exposure and measurement without imposing the same severity or pass limit on every product.

How Should PCB Coupons and Assemblies Be Prepared?

The sample must reproduce the risk-driving construction and thermal history. A generic coupon cannot represent a failure that depends on a different via diameter, finished thickness, copper distribution, laminate system, reflow exposure, or component footprint.

  1. Risk structure: Identify the exact via type, finished hole and pad geometry, layer span, surface finish, package, solder alloy, and local copper environment being evaluated. Mark the expected high-risk locations on the drawing so electrical channels and later section planes refer to the same physical features.
  2. Sample set: Define quantity, lot and panel traceability, fabrication date code, reflow exposure, bake history, moisture conditioning, and any other preconditioning. Separate variables by sample group; changing laminate, via geometry, and reflow count in the same comparison prevents a clean conclusion.
  3. Measurement path: Build a daisy chain that places the target interconnects in series while keeping external connections mechanically stable. Document which features belong to each channel and include accessible nodes when segment-level isolation may be needed after a resistance event.
  4. Baseline: Stabilize samples at the stated reference temperature, measure resistance with the intended wiring arrangement, and save channel-by-channel values before cycling. Investigate unstable baselines, connector sensitivity, or unexpected channel spread before chamber exposure rather than treating them as later degradation.
  5. Mounting: Position samples with repeatable spacing and orientation so airflow reaches both faces. Route cables with strain relief and sufficient thermal isolation; a cable bundle can shield a board, conduct heat, restrict movement, or create a false intermittent connection.
  6. Control samples: Preserve uncycled controls from the same lot and define destructive-analysis locations before the run. Controls help separate pre-existing plating or laminate features from cycling damage and provide a reference for measurements that change during section preparation.

How Is Resistance Monitored During a PCB Thermal Cycling Test?

Continuous resistance monitoring is required when a crack may open only near a temperature extreme. Room-temperature checks between cycle blocks can miss that event. The data-acquisition rate and event-duration rule must therefore be fast enough for the intended failure definition.

Daisy-chain PCB resistance monitoring during thermal cycling

For a baseline value R0 and a later value Rt, the percent resistance change is:

ΔR% = ((Rt − R0) / R0) × 100

If a daisy chain measures 100 mΩ at the controlled reference temperature and later measures 110 mΩ at the same reference temperature, the calculated change is 10%. This calculation does not make 10% the acceptance limit; the governing specification or test plan still defines failure.

Use readings taken at comparable specimen temperatures, or apply a documented temperature correction. Copper resistance naturally changes with temperature; without compensation, normal temperature response can look like degradation. Lead and connector resistance should be separated with a four-wire arrangement when their contribution is significant.

  • Baseline: Record each channel after stabilization at the stated reference temperature and retain the raw value, meter range, wiring configuration, and measurement uncertainty. A single average can hide one abnormal chain or a poor connector.
  • Sampling: State the channel count, per-channel scan interval, filtering, multiplexing sequence, and shortest detectable event. The system must sample quickly enough that a brief open is not averaged away or missed while other channels are being scanned.
  • Threshold: Define the resistance magnitude, absolute or percentage basis, minimum duration, recurrence rule, and action after an event. Store raw data around the crossing so filtering or event logic can be reviewed later.
  • Correlation: Synchronize resistance, chamber temperature, specimen thermocouples, cycle number, and chamber-state markers. This shows whether events cluster during heating, cooling, dwell, or transition and helps distinguish a fatigue crack from cable movement or electrical noise.

What Failure Criteria and Analysis Methods Should Be Used?

Write the electrical and structural failure criteria before exposure starts. Some PCB thermal cycling methods have used a 10% resistance increase, but that number is not universal. The invoked specification may instead define another percentage, an intermittent-open duration, an absolute resistance, an insulation limit, or a structural requirement.

A resistance shift identifies the electrical symptom; a microsection identifies the physical separation. The electrical trace should first be mapped to a known chain segment, after which the physical analysis can target the relevant via, plated hole, or solder attachment. The PCB cross section guide explains section preparation and the internal features that should be documented.

Microsection analysis of PCB vias after thermal cycling

  1. Event record: Preserve the cycle number, chamber and specimen temperatures, channel, resistance trace, event duration, and preceding trend when a threshold is crossed. Do not keep only the pass/fail flag; the trace shape may distinguish a gradual resistance rise, a brief intermittent open, and a connection disturbance.
  2. Ambient recheck: Repeat a controlled measurement at the baseline reference temperature to distinguish a persistent open from temperature-dependent intermittency. Recheck external connectors and cables without disturbing the suspected board feature, and document any manipulation that changes the reading.
  3. Nondestructive inspection: Use optical inspection, X-ray, acoustic methods, or other suitable imaging to narrow the search when their resolution and geometry fit the suspected defect. A negative image does not prove an intact barrel or interface when the crack orientation or material contrast is outside the method’s capability.
  4. Microsection: Cross-section the electrically mapped structure at a plane capable of revealing the suspected interface. Record preparation orientation, plating measurements, crack origin and path, nearby resin or copper features, and whether polishing could have opened or obscured the defect.
  5. Root-cause comparison: Compare failed structures with electrically unfailed specimens and uncycled controls from the same construction. Look for repeated location, geometry, material, or process patterns before assigning a cause; one visually dramatic section is not enough to establish population-level behavior.

Which PCB Design and Fabrication Factors Affect Thermal Cycling Results?

Stackup, via geometry, copper condition, material state, and thermal history jointly control the result. Review the parameters that directly change cyclic strain, current-path integrity, and defect sensitivity.

  • Board thickness and CTE: Greater through-thickness movement can increase barrel strain when copper and laminate expansion differ. Review finished thickness together with the laminate’s relevant thermal behavior and the actual temperature excursion; thickness alone does not predict fatigue.
  • Via geometry: Finished hole size, aspect ratio, capture pad, antipad, layer span, and stacked or staggered construction influence the stress path. Compare the coupon geometry with the released design and flag any test vehicle whose drill, plating span, or pad stack removes the feature being qualified.
  • Copper condition: Plating thickness, uniformity, corner coverage, interface quality, and local defects affect the available fatigue margin. Use fabrication records and cross-sectional measurements to determine whether an apparent design limitation is actually associated with nonuniform or damaged copper.
  • Material state: Resin system, glass transition behavior, moisture, cure state, and previous thermal excursions change expansion and interface response. Record material identity and conditioning rather than treating all boards with the same nominal thickness as equivalent.
  • Assembly exposure: Reflow count, peak profile, repair history, solder alloy, package size, stand-off, and local copper balance may alter the starting condition. If assembly-level risk is in scope, the qualification sample must receive a representative thermal history before cycling.
  • Test representation: A coupon must reproduce the risk-driving construction and a board assembly must reproduce the relevant thermal mass and constraints. Panel location, copper density, fixture contact, and thermocouple placement can otherwise hide a board-specific condition or create an artificial one.

How Should a PCB Thermal Cycling Test Report Be Reviewed?

A useful report makes the exposure reproducible and every electrical event traceable to a physical structure. A pass/fail statement without specimen identity, profile data, monitoring settings, and failure evidence is insufficient.

  • Identity: Record part number, revision, lot, panel and board location, sample count, stackup, materials, via construction, and fabrication or assembly history. Each electrical channel and analysis image should be traceable back to one physical specimen.
  • Method: State the standard and revision, selected condition, deviations, preconditioning, chamber type, mounting, loading, thermocouple locations, and calibration status. Explain any departure that changes severity, detectability, or comparability.
  • Profile: Provide programmed and measured chamber data together with representative specimen temperatures, tolerances, ramp or transfer time, dwell start rule, completed cycles, interruptions, alarms, and out-of-tolerance periods.
  • Electrical data: Include baseline values, wiring and instrument configuration, sampling interval, filtering, threshold and duration logic, raw traces, channel map, missing-data periods, and connector checks. A summary chart should remain traceable to the raw file.
  • Analysis: Identify the failure location, inspection sequence, image scale, microsection orientation, measurements, comparison samples, and uncertainty. Separate direct observations from the proposed mechanism and state when the physical cause remains unresolved.
  • Decision: Cite the acceptance source and report the result for every sample, not only the group average. List deviations, censored samples, early removals, retests, and unresolved anomalies so the final disposition can be reviewed without reconstructing missing context.

Confirm that the tested construction matches the released product. Results from a different layer count, via span, laminate, plating condition, or assembly state may be informative but are not automatically transferable.

FAQs About PCB Thermal Cycling Tests

Q1: How long does thermal cycling take?

A1: Test duration depends on the ramp, two dwells, transition time, cycle count, inspection intervals, loading, and chamber interruptions. A qualification run may also pause for electrical checks or sample removal. Estimate the schedule from the complete cycle profile and planned checkpoints rather than multiplying dwell time alone.

Q2: How Much Does a Thermal Cycling Test Chamber Cost?

A2: Chamber size, temperature range, transition rate, refrigeration system, channel count, calibration, fixtures, and service coverage drive capital cost. Laboratory pricing also depends on sample quantity and report depth. A useful quotation separates chamber time, setup, electrical monitoring, destructive analysis, and reporting instead of giving one unexplained total.

Q3: Do PCB thermal vias actually work?

A3: Thermal vias can reduce through-board thermal resistance when their number, diameter, plating, spacing, and copper-plane connection create a useful heat path. Filled and capped constructions may behave differently from open vias. Successful heat transfer does not prove that the same vias will survive a specified reliability cycle profile.

Q4: What is IEC 60068-2-14 thermal cycling?

A4: IEC 60068-2-14 defines temperature-change tests for electrotechnical products and includes different methods for gradual change and rapid transfer. The product specification selects the applicable severity and recovery conditions. The selected test must be invoked explicitly; the document does not create one universal PCB temperature range or acceptance limit.

Q5: What Is MIL-STD-883 Method 1010?

A5: Method 1010 addresses temperature cycling for microelectronic devices under stated test conditions, transfer limits, cycle counts, and examination requirements. Its specimen and qualification context differ from board-level interconnect testing. It should not be substituted automatically for a bare-board, coupon, or assembled-PCB requirement.

Q6: What is the standard for thermal shock test?

A6: Several standards contain thermal-shock or rapid-temperature-change methods, depending on the product, specimen, and industry. The correct method may use air-to-air transfer, liquid media, or another controlled transition. The test plan and report must identify the exact document, revision, condition, transfer method, dwell definition, and specimen limits.

Q7: What is the thermal cycling life test?

A7: A life test extends cycling until a defined failure population or censoring point supports statistical fatigue analysis. It needs sample traceability, a consistent failure criterion, and surviving-sample records. The resulting model is defensible only when laboratory and service failures share the same physical mechanism and the acceleration assumptions remain valid.

Q8: What are some common problems with thermal cyclers?

A8: Common equipment issues include sensor drift, poor airflow, fixture shielding, refrigeration limits, door-seal leakage, condensation, channel noise, and specimen lag. A loaded chamber may respond differently from an empty qualification check. Independent specimen thermocouples and scheduled calibration help distinguish the programmed chamber command from the board’s actual exposure.

Q9: What is the standard thermal test?

A9: There is no single standard thermal test for every product. Thermal cycling, thermal shock, high-temperature storage, powered operation, and current-induced cycling create different stresses and answer different questions. Start with the target failure mechanism, specimen type, and acceptance document, then select the method and condition that match that decision task.

Q10: What is the purpose of thermal cycle test?

A10: The purpose may be screening, process comparison, design qualification, failure-mechanism study, or fatigue-life characterization. Those objectives require different sample quantities, measurements, and analysis depth. The stated objective determines the specimen, temperature profile, monitoring resolution, inspection intervals, failure rule, and stopping point.

Conclusion

A defensible PCB thermal cycling test links a representative specimen, verified specimen temperatures, synchronized resistance data, prewritten failure criteria, and physical confirmation. Select the method from the risk-driving structure and preserve enough evidence to reproduce the exposure and explain the result.

If thermal cycling evidence is required for an upcoming PCB program, send the Gerber or ODB++ data, stackup, via details, material requirements, intended temperature profile, applicable standard and revision, monitoring plan, and required report fields to sales@bestpcbs.com for a documented feasibility review and quotation.

SPDT Switch Guide: Wiring, Types, Ratings and PCB Design

August 4th, 2026

SPDT means single pole, double throw: one common contact can connect to either of two switched contacts. An SPDT switch is therefore useful when a circuit must select between two signal paths, operating modes or power sources. The three-terminal concept is simple, but a reliable design still depends on the contact arrangement, load type, actuator, footprint, switching sequence and PCB assembly method.

SPDT Switch Guide: Wiring, Types, Ratings and PCB Design

What Is an SPDT Switch?

An SPDT switch has one pole and two throws. The pole is the common moving contact, and the throws are the two alternative contacts it can reach. A typical mechanical SPDT device therefore has three electrical terminals. In one actuator position, COM connects to the first throw; in the other position, COM connects to the second. The two throw terminals are not normally connected to each other.

The term describes the contact function rather than the external shape. A toggle switch, slide switch, pushbutton, microswitch, relay contact set or semiconductor switch can all provide an SPDT function. The package, pinout, operating force, switching speed and electrical limits can be completely different, so the abbreviation alone is not enough to select a part.

What Do Pole and Throw Mean in SPDT?

A pole is an independently controlled circuit path. Single pole means the actuator controls one common path. A throw is one selectable contact position for that pole. Double throw means the common path can be routed to either of two contacts. This naming system also explains other common forms: SPST controls one path with one throw, while DPDT operates two SPDT contact sets from one actuator.

Do not interpret double throw as two outputs being powered simultaneously. In a standard SPDT function, the common contact selects one throw at a time. A center-off ON-OFF-ON switch adds a mechanical position in which COM connects to neither throw, but it is still a double-throw device.

How Does an SPDT Switch Work?

Inside a mechanical SPDT switch, the actuator moves a conductive contact between two stationary contacts. The electrical state changes from COM-to-throw-A to COM-to-throw-B. Many devices are break-before-make, meaning the first path opens before the second path closes. Some specialized parts are make-before-break and briefly connect both paths during transfer. That switching sequence must come from the datasheet because it affects source selection, analog signals and circuits that cannot tolerate an open interval or path overlap.

Mechanical contacts also bounce during actuation. Instead of changing state once, the contacts may make and break several times over a short interval. A lamp may not reveal the effect, but a microcontroller input can register multiple transitions. Hardware filtering, a Schmitt-trigger input or firmware debounce may be necessary when one operation must produce one digital event.

SPDT common contact switching between two throw terminals

What Are COM, NO and NC Terminals?

COM is the common terminal connected to the movable contact. On a snap-action switch or relay contact set, NC is connected to COM in the normal, unactuated state, while NO connects to COM after actuation. The normal state is defined by the manufacturer and may refer to an unpressed plunger, a de-energized relay coil or another specified rest condition.

A generic ON-ON toggle or slide switch may label its pins as common, position 1 and position 2 instead of NO and NC. Physical pin position is not a dependable identification method. Read the terminal diagram and pin numbering for the exact part. When markings are unclear, disconnect power and use continuity mode to identify which pin alternately connects to the other two.

How Do You Read an SPDT Switch Diagram?

An SPDT diagram shows one movable line starting at the common terminal and pointing toward one of two fixed contacts. The drawn position usually represents the normal or unactuated state, not necessarily the visual direction of the installed actuator. Pin numbers beside the symbol must be matched to the footprint and manufacturer drawing.

Symbol orientation can be rotated or mirrored without changing the electrical function. For a closer look at IEC and ANSI representations, different actuator symbols and the distinction between switch and relay drawings, see the BestPCBs guide to the switch SPDT symbol.

How Do You Wire an SPDT Switch?

Start by deciding what the common terminal should carry. For a mode selector, COM may connect to a microcontroller input while the two throws connect to defined logic levels through suitable pull resistors. For source selection, COM may feed the load while the throws connect to two approved sources. The arrangement can also be reversed when the circuit function requires one source to select between two destinations.

Before wiring, check that the switch rating covers the actual voltage, current and load type. A DC motor, relay coil, solenoid, lamp or capacitive input can produce inrush or inductive transients that are more severe than a steady resistive load. Use the protection recommended for the load, such as a flyback path for a DC coil or an appropriate snubber or suppression device. Never assume an AC rating can be applied unchanged to DC.

  • Confirm the exact COM and throw pin numbers from the datasheet.
  • Choose ON-ON, ON-OFF-ON or momentary action to match the required states.
  • Keep low-level signals away from noisy power-switching traces.
  • Define the state of every MCU input; do not leave a selected or unselected node floating.
  • Verify both actuator positions with continuity before applying system power.

Which SPDT Switch Types Are Available?

The correct type depends on how the circuit is operated and what must be switched. The contact function may be the same, but the mechanical and electrical behavior is not interchangeable.

SPDT type Typical action Useful design consideration
Toggle switch Maintained ON-ON or ON-OFF-ON Panel clearance, lever access and mechanical support
Slide switch Maintained position selection Compact PCB mounting, travel direction and board-edge access
Momentary pushbutton or microswitch Spring return after release Operating force, overtravel, debounce and actuator alignment
SPDT relay contact Electrically actuated changeover contact Coil drive, isolation, contact rating and flyback suppression
Analog or RF SPDT IC Electronic signal routing On-resistance, bandwidth, insertion loss, isolation and control levels
Toggle, slide and momentary SPDT switch types

A mechanical SPDT switch creates galvanic metal-to-metal contact and may switch signals or power within its rating. An SPDT relay separates the control coil from the switched contact set. A semiconductor SPDT switch has no mechanical actuator and is selected by a logic signal; its specifications use parameters such as on-resistance, leakage, bandwidth or isolation. Treat these as different component classes even when the block diagram shows one input and two selectable paths.

Where Are SPDT Switches Used?

SPDT devices are used wherever one path must select between two alternatives. Common examples include operating-mode selectors, source selection, limit detection, interlocks, test routing, alarm contacts, audio signal selection and communication or instrumentation signal paths. Automotive and industrial systems also use sealed snap-action SPDT switches for position sensing, provided the environmental and load ratings are appropriate.

In low-voltage electronic products, a PCB-mounted slide or toggle switch often selects boot mode, battery or adapter input, local or remote control, or one of two signal routes. A microswitch can report two complementary states through NO and NC contacts. An SPDT relay can switch a load from a primary path to a backup path, while an analog or RF SPDT IC handles high-speed or low-level signals without a mechanical actuator.

How Does SPDT Compare with SPST and DPDT?

The decision depends on how many independent circuits must be controlled and how many selectable paths each circuit needs. Use the simplest contact form that supports the required states; extra poles and terminals increase footprint, wiring and verification work.

Contact form Independent poles Throws per pole Typical terminals Typical use
SPST 1 1 2 Basic on/off control
SPDT 1 2 3 Select one of two paths
DPST 2 1 4 Open or close two circuits together
DPDT 2 2 6 Switch two paths together or reverse a paired connection

An SPDT switch can be used as a simple on/off contact by using COM and one throw while leaving the other throw unconnected, but a purpose-built SPST part may be smaller or clearer. A DPDT part is appropriate when two isolated conductors must change together. Its suitability for a load still depends on the exact electrical rating; the extra pole does not automatically make it a higher-power switch.

Which SPDT Ratings Matter Most?

Contact configuration is only the first selection field. A datasheet should be checked for both electrical and mechanical limits. Values from one switch family cannot be generalized to all SPDT devices.

  • Voltage and current rating: confirm AC or DC rating and the specified resistive, inductive, motor or lamp load.
  • Minimum applicable load: important for dry-circuit and low-level signals because some contact materials need sufficient wetting current.
  • Initial and end-of-life contact resistance: relevant to voltage drop, heat and small-signal integrity.
  • Electrical and mechanical life: electrical life is measured under stated load conditions; mechanical life is normally measured without load.
  • Insulation resistance and dielectric strength: define isolation performance between contacts and non-live parts.
  • Operating force, travel and actuator life: determine user feel, mechanism compatibility and mechanical margin.
  • Temperature, humidity and sealing: match the actual environment and cleaning process.
  • Terminal and mounting style: choose through-hole, surface-mount, panel, wire lead or connector termination to fit assembly needs.

For example, official switch datasheets may specify contact resistance, insulation resistance, dielectric strength and separate mechanical and electrical durability values. Those numbers are test-condition dependent. Compare the intended load and operating environment with the exact datasheet rather than selecting a switch from contact form alone.

How Should an SPDT Switch Be Placed on a PCB?

Use the manufacturer-recommended land pattern and pin numbering, then verify it against the component drawing before releasing Gerber data. For through-hole switches, plated-hole diameter must accommodate the maximum terminal dimension plus insertion and plating allowance. For SMT switches, pad geometry, solder volume and coplanarity affect both solder quality and mechanical strength.

SPDT switch footprint, board-edge placement and mechanical support on PCB

Place a user-operated switch where the actuator can be reached without transferring excessive force into the PCB. Board-edge placement may simplify enclosure access, but it reduces surrounding board material and can increase flexing. Add mounting support, enclosure features or a panel-mounted part when the expected force is too high for solder joints alone. Keep copper, components and enclosure walls outside the actuator travel and body keepout.

Route COM and the two throws according to signal sensitivity. Keep switch nodes short when they carry high-impedance analog signals, clocks or fast edges. Separate noisy switched loads from low-level logic, and provide return paths and suppression components close to the relevant devices. Compact interfaces may use an HDI PCB, while conventional controls commonly use an FR4 PCB; the footprint and mechanical requirements remain part-specific in either case.

How Do You Test an SPDT Switch with a Multimeter?

Remove circuit power and discharge stored energy before using continuity or resistance mode. If the switch is already on a PCB, parallel paths can affect the reading, so compare the schematic and isolate a terminal when necessary.

  1. Identify the three candidate terminals from the datasheet or board drawing.
  2. Place one probe on the suspected COM terminal and the other on one throw.
  3. Operate the switch and note the position that produces low resistance or a continuity tone.
  4. Move the second probe to the other throw and repeat the operation.
  5. Confirm that the two throws do not show continuity to each other in either normal position.
  6. Watch for unstable or unexpectedly high resistance that may indicate contamination, wear, a cracked joint or a wrong pin assumption.
Testing an SPDT switch with a digital multimeter in continuity mode

A slow multimeter may not display brief bounce or transfer timing. Use an oscilloscope or logic analyzer when the circuit depends on debounce duration, break-before-make interval or high-speed signal behavior.

What Common SPDT Circuit Problems Should Be Checked?

Start with pinout and contact state. A footprint mirrored from the wrong view can swap the common and throw terminals. A schematic may also use a generic symbol whose pin numbers do not match the selected component. Verify the manufacturer drawing, PCB footprint, placement orientation and assembled board together.

Intermittent behavior can come from contact bounce, insufficient wetting current, contamination, overload, inductive arcing, weak solder joints or PCB flex around the switch. If the fault occurs only under mechanical pressure, inspect the actuator alignment, housing interference and board support. If it occurs only with the load connected, compare inrush and transient conditions with the contact rating and protection network.

Production checks should cover solder fillet quality, terminal alignment, actuator movement and electrical state in every required position. Functional fixtures can verify that COM reaches the intended throw and that the product firmware interprets the state correctly.

How Do You Select an SPDT Switch for a PCB Assembly?

Define the required states first: maintained or momentary, ON-ON or ON-OFF-ON, and break-before-make or make-before-break. Then match the electrical load, minimum signal level, expected cycles, environment, actuator force, enclosure geometry and assembly process. Confirm that the supplier drawing includes an unambiguous footprint, pin numbering, body keepout and recommended soldering conditions.

The component package must also fit the production method. Through-hole switches may need selective or hand soldering after SMT reflow; surface-mount switches require appropriate paste apertures and support against operating force. EBest Circuit (Best Technology) provides PCB assembly covering SMT, through-hole and mixed assembly. Available inspection and test processes include 3D SPI, AOI, X-ray and functional testing, selected according to the board and assembly. Stated maximum capabilities remain subject to component package, board design, materials, quantity and engineering review.

FAQ About SPDT

What is an SPDT switch?

It is a single-pole, double-throw switch in which one common contact connects to either of two alternative contacts. A typical mechanical device has three electrical terminals.

What is the difference between an SPDT and DPDT switch?

SPDT controls one common path and selects between two throws. DPDT contains two poles that are operated together, with two throws available for each pole. A typical DPDT device therefore has six switched terminals.

What are the differences between SPST and SPDT switches?

SPST opens or closes one path and normally has two terminals. SPDT routes one common path to either of two contacts and normally has three terminals.

Is a 3-way switch an SPDT switch?

In North American building wiring, a mechanical 3-way switch commonly performs an SPDT changeover function. Mains wiring must follow the applicable electrical code and device instructions; PCB-level signal switching is a different installation context.

Can an SPDT switch be used as an SPST switch?

Yes. Use COM and one throw, leaving the other throw unconnected and safely isolated. A dedicated SPST switch may still provide a smaller footprint or clearer function.

Does an SPDT switch always have NO and NC terminals?

No. Snap-action switches and relay contacts often use COM, NO and NC labels relative to a defined normal state. Maintained ON-ON switches may identify the two throws by position instead. Always use the exact datasheet and continuity test.

Conclusion

SPDT describes a one-pole, two-throw contact function, but a successful design depends on much more than the abbreviation. Confirm the three-terminal pinout, switching sequence, actuator action, load rating, contact life, footprint, mechanical support and test method for the exact part. When the switch is integrated into a PCB assembly, layout and production controls should protect both the signal path and the soldered mechanical interface.

For support with PCB fabrication, component assembly or functional testing for a control product using SPDT devices, contact EBest Circuit (Best Technology) at sales@bestpcbs.com.

Reliable Battery Cell Monitoring System PCBA Guide for Safer Packs

August 4th, 2026

A battery cell monitoring system helps a battery pack collect cell-level voltage, temperature, and status data so the control system can make safer decisions. In electric mobility, energy storage, industrial backup power, test equipment, and smart battery products, a weak monitoring board can turn a promising pack into a difficult validation project.

For engineers and buyers, the practical question is not only how the monitoring circuit works. The harder question is whether the PCB, connectors, sampling paths, insulation spacing, component sourcing, SMT assembly, coating, testing, and packing can stay controlled from the first prototype to small-batch production.

EBest Circuit (Best Technology) supports battery-related PCB and PCBA projects with PCB fabrication, BOM sourcing, SMT assembly, inspection, functional test coordination, and manufacturing review. If you already have Gerber files, BOM, stackup, connector notes, test requirements, or assembly drawings, send them to sales@bestpcbs.com for an engineering review before production starts.

battery cell monitoring system
Battery monitoring PCBA projects need connector, sampling, testing, and assembly details controlled together.

What Is a Battery Cell Monitoring System?

A battery cell monitoring system is the part of a battery pack that observes individual cell conditions and sends that information to the battery management system or control unit. It may monitor cell voltage, temperature, balancing status, communication signals, and fault-related conditions.

On the PCB side, this usually means the board must connect safely to many cells, route small sensing signals cleanly, keep high-voltage and low-voltage areas separated, and allow the assembled board to be tested before shipment.

For a real PCBA project, the files should make these points clear:

  • cell count and connector pin order;
  • cell voltage sampling paths;
  • temperature sensor locations;
  • battery monitoring chip part number;
  • communication interface, such as CAN, UART, SPI, or isolated communication;
  • creepage, clearance, slots, coating, or insulation requirements;
  • test method and pass/fail criteria;
  • packing method for assembled boards.

This article does not try to replace the customer’s battery algorithm, pack architecture, or protection strategy. It focuses on the manufacturing details that decide whether a released battery cell monitoring system board can be built and verified reliably.

Battery Cell Monitoring System vs Battery Management System

A battery cell monitoring system and a battery management system are closely related, but they are not always the same scope. Many search results use these terms together, so it helps to separate the board-level manufacturing view from the full system view.

TermPractical Meaning
Battery cell monitoring systemMeasures cell-level data
Battery management systemControls protection and pack behavior
BMS PCBPCB used inside a BMS product
Monitoring PCBAAssembled board for sensing and communication

A full BMS may include protection logic, balancing strategy, current sensing, contactor control, state estimation, communication, firmware, and safety decisions. The monitoring board may be one part of that system.

For PCB and PCBA manufacturing, the responsibility should be clear. The customer defines the electrical design, monitoring IC, firmware, pack architecture, and safety logic. The PCB/PCBA supplier checks whether the released files can be fabricated, assembled, inspected, and tested according to the agreed production requirements. For broader background, this related guide explains what a BMS PCB board is.

Battery Cell Voltage Monitoring System for Accurate Readings

A battery cell voltage monitoring system depends on small voltage differences that must be routed from the pack connector to the monitoring IC without avoidable assembly or manufacturing errors. A wrong connector pin order, unclear net name, poor soldering, missing test pad, or contaminated connector area can make debugging painful.

battery cell monitoring system
Cell sensing lines, connector pins, and test pads should be clear before SMT assembly.

Before production, useful checks include:

  • matching the connector drawing with the PCB footprint;
  • checking connector orientation and pin 1 location;
  • confirming test pads for key sensing nets;
  • reviewing resistor and capacitor placement near the sampling path;
  • checking solder mask openings around dense connector pins;
  • making sure sampling nets are not confused during harness assembly;
  • confirming inspection access after SMT.

If the first prototype shows unstable cell readings, the root cause may not be the monitoring IC itself. It may be a connector issue, soldering defect, poor test access, wrong component value, or file mismatch. That is why BOM, Gerber, CPL, connector drawing, and test notes should be reviewed together.

Cell Monitoring System PCB Interfaces That Reduce Assembly Risk

A cell monitoring system is usually connector-heavy. The PCB may connect to cell taps, NTC thermistors, pack current paths, communication lines, programming pads, external harnesses, and sometimes an enclosure or shield structure. Each interface is a possible failure point if the drawings are incomplete.

The most useful interface details are the ones that prevent rework:

  • connector series, pitch, height, locking direction, and mating part;
  • wire harness direction and keep-out areas;
  • current rating for power or balancing paths;
  • mechanical support for heavy connectors;
  • test access for production verification;
  • polarity and pin sequence markings;
  • packing protection for exposed connector pins.

For buyers, this is where a one-stop PCB and PCBA workflow reduces handoff risk. If PCB fabrication, component sourcing, SMT, through-hole soldering, cleaning, inspection, and packing are coordinated separately, connector notes can be missed. EBest Circuit keeps these notes visible from file review to shipment.

Battery Monitoring Chip Placement for Stable PCBA Performance

A battery monitoring chip is often the most important IC on the board. Its placement affects sensing trace length, filter component placement, isolation strategy, thermal exposure, programming or communication access, and inspection after SMT.

EBest Circuit does not choose the customer’s monitoring chip or define the battery algorithm. The approved IC, circuit, and firmware come from the customer’s engineering team. The manufacturing review focuses on whether the selected package, footprint, BOM data, and assembly files match the physical build.

Typical PCBA risks around the monitoring IC include:

  • wrong IC package or footprint version;
  • pin 1 mismatch between datasheet, PCB footprint, and CPL file;
  • fine-pitch solder bridging;
  • insufficient solder on small passives near the IC;
  • missing test access for communication or programming;
  • thermal exposure from nearby power components;
  • unclear firmware or test-step requirements.

If the project includes customer-provided firmware or programming files, the programming method and verification step should be defined before assembly. For related production flow, this article on IC programming explains how firmware loading can fit into PCBA production.

Battery Monitoring System PCB Safety for High-Voltage Packs

Battery monitoring system PCB safety becomes more important as cell count, pack voltage, and enclosure constraints increase. A monitoring board may carry only sensing current, but it can still connect to high pack potential through the cell tap harness. Manufacturing details must respect the customer’s released safety spacing and insulation requirements.

battery cell monitoring system
Clearance, slots, coating edges, and connector areas should be checked before battery monitoring PCB production.

Safety-related PCB manufacturing points may include:

  • creepage and clearance between cell groups;
  • slots, cutouts, or keep-out areas;
  • solder mask dams and exposed copper control;
  • board thickness and mechanical stiffness;
  • surface finish and solderability;
  • conformal coating or potting notes;
  • connector spacing and insulation barriers;
  • mounting hole clearance from high-voltage nets.

The PCB manufacturer should not change the safety spacing or net relationships without approval. However, the supplier should flag unclear drawings, missing slots, tight copper spacing, or coating conflicts before production. For boards used in sealed or harsh environments, PCB encapsulation or conformal coating requirements should also be reviewed before assembly.

Battery Management System Cell Monitoring Diagram Before Production

A battery management system cell monitoring diagram is useful only when it can be translated into clear PCB and PCBA files. A diagram may show cell taps, sense resistors, NTCs, isolation, communication, balancing circuits, and pack connectors, but the factory still needs released manufacturing data.

Before quotation or production, prepare:

  • Gerber or ODB++ files;
  • NC drill files;
  • stackup and finished board thickness;
  • BOM with manufacturer part numbers;
  • CPL or pick-and-place file;
  • assembly drawing;
  • connector drawings and mating connector notes;
  • coating, cleaning, and packing requirements;
  • test instructions and acceptance criteria.

The diagram helps explain intent, but it should not replace production files. If a diagram and Gerber data conflict, the customer should confirm which document controls the build before PCB fabrication starts. The same principle applies to custom BMS PCB projects where the board must fit both electrical and mechanical requirements.

Battery Monitoring Unit Assembly for Prototype and Small-Batch Builds

A battery monitoring unit prototype is often small in quantity but high in consequence. One incorrect connector, one wrong resistor value, or one missing test point can delay pack validation and make the engineering team question whether the issue comes from the circuit, assembly, harness, or test setup.

battery cell monitoring system
A test fixture helps verify assembled battery monitoring boards before delivery.

For prototype and small-batch PCBA, the useful production path is:

  • review PCB files, BOM, CPL, drawings, and connector notes together;
  • confirm unavailable or risky components before SMT scheduling;
  • check polarity, pin 1, connector orientation, and test access;
  • prepare SMT, through-hole, cleaning, and inspection steps;
  • run AOI, visual inspection, and agreed functional checks;
  • pack finished boards to protect connectors and exposed pins.

Small quantity does not remove process risk. A two-piece prototype still needs correct materials, controlled assembly, and usable inspection. For projects moving from prototype to pilot build, PCB assembly support should be aligned with the test plan and delivery schedule.

Battery Cell Monitoring System Case Study for a PCBA Project

A European customer needed a small-batch monitoring PCBA for an industrial battery pack used in energy storage validation. The customer had already released the electrical design, monitoring IC selection, and firmware. The main request was to build a small quantity of boards that could support stable connector contact, cell voltage sampling, communication testing, and clean inspection before pack-level validation.

Project snapshot:

  • Customer region: Europe;
  • Application: industrial energy storage battery module;
  • Build type: prototype to small-batch PCBA;
  • PCB: multilayer FR4 monitoring board;
  • Key concerns: connector order, cell sampling stability, isolation spacing, SMT quality, and test access;
  • Delivery need: engineering validation boards before next pack test round.

Manufacturing challenge:

  • The board used dense connectors for cell tap inputs and temperature signals.
  • Several sampling nets needed clear test access after assembly.
  • Connector direction and harness routing had to match the customer’s enclosure plan.
  • The project required a practical inspection path before the boards were packed.

EBest Circuit support:

  • Reviewed Gerber data, BOM, CPL, assembly drawing, and connector notes together.
  • Checked connector footprint, orientation, and polarity markings before SMT.
  • Confirmed test pads for key sensing and communication nets.
  • Coordinated PCB fabrication, component sourcing, SMT assembly, inspection, and packing under one workflow.
  • Kept engineering questions visible before production rather than during final inspection.

The customer received assembled monitoring boards for pack validation with connector, sampling, inspection, and packing details controlled as one project. The value was not only receiving the boards. The value was reducing uncertainty before the customer connected the PCBA to a real battery module.

Why this matters for battery monitoring PCBA projects: battery monitoring builds are not forgiving. If the board has unclear connector notes, unstable sampling access, poor soldering, weak traceability, or missing test instructions, the customer may lose time during pack validation. EBest Circuit is useful when the buyer needs PCB fabrication and PCBA assembly details coordinated by one team.

Support that matters during a battery monitoring build:

  • PCB fabrication and stackup review;
  • BOM sourcing based on approved part numbers;
  • SMT and through-hole assembly;
  • connector and polarity review;
  • AOI, visual inspection, and agreed test coordination;
  • coating, cleaning, and packing notes when required;
  • prototype, sample, and small-batch production support.

EBest Circuit has supported PCB and PCBA manufacturing since 2006, with ISO9001, ISO13485, IATF16949, AS9100D, RoHS, REACH, and UL-related quality support. For battery-related projects, that background helps keep file review, purchasing, assembly, inspection, and delivery communication connected.

FAQs About Battery Cell Monitoring System PCBA

1. Is a battery cell monitoring system the same as a BMS?

No. A battery cell monitoring system usually focuses on collecting cell-level data. A BMS has a broader role and may include protection, balancing, current measurement, firmware, communication, and pack control.

2. What files are needed for battery monitoring PCBA assembly?

Useful files include Gerber or ODB++, drill files, stackup, BOM, CPL, assembly drawing, connector drawings, coating notes, test requirements, and packing instructions.

3. Can EBest Circuit design the battery management algorithm?

No. The battery algorithm, pack architecture, protection logic, and firmware should come from the customer’s engineering team. EBest Circuit supports PCB fabrication, BOM sourcing, PCBA assembly, inspection, and agreed testing coordination.

4. Why are connectors important in battery cell monitoring boards?

The connectors carry cell tap, temperature, communication, or power-related signals. Wrong orientation, unclear pin order, weak soldering, or poor packing can create validation problems.

5. Should battery monitoring PCBAs be tested before shipment?

Yes. The test scope depends on the customer requirement, but visual inspection, AOI, connector checks, continuity-related checks, and agreed functional verification can reduce avoidable risk before delivery.

All in all, a battery monitoring board should arrive ready for the customer’s validation work, not as another source of uncertainty. If your next battery cell monitoring system project includes dense connectors, cell sampling paths, coating notes, test requirements, or small-batch PCBA assembly, send the released files to sales@bestpcbs.com. EBest Circuit can review the manufacturing path before the build moves into production.

How to Use a Multimeter: Voltage, Current and PCB Tests

August 4th, 2026

how to use a multimeter correctly starts with three decisions: choose the measurement function, place the red lead in the correct input jack, and connect the probes in the right way. Voltage is measured across two points on a powered circuit, while resistance and continuity are checked with power removed. Current is different because the meter must become part of the circuit. This guide explains those measurements, the readings you may see, and a safe method for checking batteries, components and printed circuit boards.

How to Use a Multimeter: Voltage, Current and PCB Tests

What Is a Multimeter and What Can It Measure?

A multimeter is a test instrument that combines a voltmeter, ammeter and ohmmeter. A basic digital multimeter measures AC/DC voltage, DC current, resistance and continuity. Depending on the model, it may also test diodes, capacitance, frequency, duty cycle and temperature. The display resolution, accuracy, input protection and available functions vary, so the meter manual remains the authority for terminal limits and range selection.

The measurement mode determines what the meter does internally. In voltage mode, the meter presents a high input impedance and samples the potential difference between two points. In current mode, current passes through a low-value shunt and a protected input path. In resistance or continuity mode, the meter applies a small internal test signal to the unpowered circuit. These differences explain why a connection that is correct for voltage can be destructive in current mode.

Function Circuit power Probe connection Typical electronics use
DC/AC voltage On for operating measurements Across two points, in parallel Check batteries, power rails and voltage drop
Resistance Off and discharged Across the isolated part or nodes Check resistor values and unexpected resistance
Continuity Off and discharged Across a wire, trace, fuse or connection Find opens and confirm low-resistance paths
Current On after the meter is inserted Break the circuit and connect in series Measure branch or load current
Diode test Off and discharged Across the diode in both directions Compare forward drop and reverse blocking

What Do the Multimeter Symbols, Ports and Probes Mean?

The black lead normally goes into COM. For voltage, resistance, continuity and diode measurements, the red lead normally goes into the terminal marked V, Ω, a diode symbol or a combined label. Separate mA/µA and A terminals are used for current, and their maximum current and fuse protection differ by model. Never assume that the layout or limit of one meter applies to another.

  • V with a straight/dashed line: DC voltage.
  • V~: AC voltage.
  • Ω: resistance in ohms.
  • Sound-wave symbol: continuity; the exact beep threshold is model-specific.
  • Diode symbol: diode forward-voltage test.
  • A, mA or µA: current ranges using the appropriate current input.
  • OL: over-limit, over-range or an open path, depending on the selected function.

Probe insulation, exposed tip length and lead ratings are part of the safety system. Inspect both leads for cracked insulation, loose plugs or bent tips before use. A more detailed multimeter symbol guide can help identify secondary functions that share one dial position.

Digital multimeter ports, probes and measurement settings

How Do You Set Up a Multimeter Safely?

Start by identifying the expected voltage, whether the signal is AC or DC, and whether the circuit must remain powered for the test. Check that the meter, probes, CAT category and voltage rating are suitable for the measurement environment. For energized work, verify the meter on a known source before and after the test. Do not use a damaged meter, damaged leads or an instrument whose protection rating is unknown.

  1. Inspect the case, input jacks, leads and probe insulation.
  2. Insert the black lead into `COM`.
  3. Insert the red lead into the voltage/resistance terminal unless the procedure specifically requires a current terminal.
  4. Select the function before touching the probes to the circuit.
  5. For manual ranging, begin above the expected value and step down for better resolution.
  6. Turn power off and discharge stored energy before resistance, continuity, diode or capacitance tests.
  7. After a current test, return the red lead to the voltage/resistance terminal immediately.

This article focuses on batteries, low-voltage electronics and PCB work. Measuring exposed mains wiring or distribution equipment requires appropriate training, PPE, test practices and a meter rated for that installation category. If the source, category or safe isolation method is uncertain, stop and use a qualified electrician or technician.

How to Test for Voltage Using a Multimeter?

Voltage is measured in parallel, so the probes contact two points without opening the circuit. Set the meter to DC voltage for batteries and most PCB power rails, or AC voltage for alternating signals within the meter’s specified frequency range. Keep the red lead in the voltage terminal and the black lead in `COM`.

  1. Select AC or DC voltage and an appropriate range.
  2. For DC electronics, connect the black probe to circuit ground or the negative reference.
  3. Touch the red probe to the test point, regulator output or positive terminal.
  4. Read the value and unit. A negative DC reading usually means the probes are reversed relative to the chosen reference.
  5. Compare the result with the schematic, component datasheet or expected tolerance rather than treating any non-zero value as correct.

On a PCB, keep probe tips from bridging adjacent pads. Fine-pitch test points may require insulated needle probes or grabbers. A voltage that collapses only under load can indicate excessive series resistance, current limiting, an overloaded regulator or a downstream short. For the difference between DC and AC markings, see the DC voltage symbol guide.

Multimeter measuring low-voltage PCB test points

How to Check Resistance With a Multimeter?

Resistance must be measured on an unpowered, discharged circuit. Set the dial to Ω, connect the probes across the component or path, and wait for the reading to settle. On a manual-ranging meter, OL can mean the selected range is too low; move to a higher range before concluding that the path is open.

In-circuit readings may be lower than the marked component value because other branches are connected in parallel. Semiconductor junctions, capacitors and IC protection networks can also make the reading change with probe polarity or time. If the result matters, isolate one lead of the component or compare the same nodes on a known-good board. Short the probes together first to see the lead resistance; very low-value measurements need compensation or a four-wire instrument for useful accuracy.

How to Test Continuity Using a Multimeter?

Continuity mode checks whether resistance is below the meter’s audible threshold. With power removed and capacitors discharged, touch the probes together to confirm the beeper and leads work. Then place the probes across the trace, cable, switch contact or fuse under test. A beep plus a low displayed resistance supports a continuous path; no beep or `OL` indicates an open path or resistance above the threshold.

Do not rely on sound alone. Different meters beep at different resistance values, and a partially damaged connection may still beep while adding enough resistance to fail under load. Read the displayed resistance and, when relevant, compare it with an intact path. For a fuse, remove power and preferably isolate the fuse from parallel paths before testing. A good fuse should read close to the lead resistance; `OL` in both directions indicates an open fuse.

How to Measure Current With a Multimeter?

Current measurement requires the meter to be inserted in series so the branch current flows through its internal shunt. Turn circuit power off first, move the red lead to the correct fused current terminal, select AC or DC current, open the circuit at a controlled point, and connect the meter across that break. Start with the highest protected range if the expected current is uncertain.

  1. Confirm the current terminal rating, fuse rating and allowable measurement duration in the manual.
  2. De-energize the circuit before inserting or removing the meter.
  3. Connect the meter in series, never directly across a voltage source.
  4. Reapply power and observe the reading without exceeding the input limit.
  5. Turn power off, remove the meter, restore the circuit and return the red lead to the voltage/resistance terminal.

A meter in current mode behaves like a low-resistance path. Placing it across a battery or power rail can create a short circuit, blow the meter fuse, damage the probes or release substantial energy. For current that cannot be interrupted safely, use a suitable current clamp, current probe or circuit shunt instead of forcing a series measurement.

How to Test a Diode With a Multimeter?

Use diode mode with the circuit unpowered and discharged. Place the red probe on the anode and the black probe on the cathode, record the forward-voltage reading, then reverse the probes. A normal silicon diode often shows a forward drop and `OL` in reverse, but the expected value depends on diode chemistry, current and temperature. An LED may require more test voltage than some meters provide.

Readings in both directions can be affected by parallel components. If both directions look shorted, both show `OL`, or the result conflicts with the circuit behavior, isolate one diode lead and repeat the test. The dedicated article on how to test a diode with a multimeter explains forward and reverse interpretations in more detail.

How to Test Batteries Using a Multimeter?

Set the meter to DC voltage above the battery’s nominal voltage, keep the red lead in the voltage terminal, and measure directly across the battery terminals. Place black on negative and red on positive. A reversed connection produces a negative sign; it does not mean the battery itself is generating negative voltage.

Open-circuit voltage is only a first check. A weak battery may show near-normal voltage without load and collapse when it supplies current. Compare the reading with the battery chemistry, state-of-charge chart and equipment requirements, then repeat under a safe specified load if the application requires it. Do not short the terminals with probes or move the red lead to the current jack for a direct battery measurement.

How to Test a Circuit Board With a Multimeter?

Begin with the schematic, board drawing and a visual inspection. Locate ground, power-entry points, regulator outputs, fuses, connectors and labeled test pads. With power removed, check suspect fuses, cables and traces for continuity, then look for unexpectedly low resistance between a power rail and ground. Only after those checks should the board be powered for voltage measurements.

  1. Power off: inspect for cracked joints, lifted pads, corrosion, damaged components and debris.
  2. Power off: verify ground continuity and selected signal paths without probing across stored energy.
  3. Power off: compare resistance-to-ground on major rails, allowing capacitors time to charge from the meter’s test current.
  4. Power on: measure input voltage, protection-device output and regulator rails against the schematic.
  5. Compare: check equivalent channels or a known-good board before replacing components.

A handheld meter is useful for accessible paths on an FR4 printed circuit board, but it does not prove that every solder joint, inner-layer connection or component operates correctly. The broader PCB board testing checklist explains how visual, electrical and functional checks complement one another.

Technician checking PCB power rails with a digital multimeter

How Do You Find Shorts, Open Circuits and Bad Components?

A suspected short should be confirmed with power removed by comparing resistance between the affected rail and ground against the schematic, a matching channel or a known-good board. Low resistance is not automatically a fault: processor core rails, heaters and high-current loads can be designed to have low resistance. If a rail is genuinely shorted, divide the circuit by removing links, disconnecting loads or testing sections, following the service documentation.

For an open circuit, test continuity from one accessible node to the next instead of probing an entire path at once. This narrows the fault to a connector, via, trace or solder joint. On an HDI PCB, microvias and buried interconnects may not be physically accessible, so a meter can confirm a missing connection but may not identify the internal failure location. Cross-section analysis, flying-probe data, X-ray or other production records may be needed.

Component tests also have limits. Resistors are affected by parallel paths; capacitors can look like a changing resistance while charging; MOSFET body diodes influence readings; and IC pins contain protection structures. If an in-circuit result is ambiguous, isolate the component or use the equipment specified for the signal. A multimeter cannot replace an oscilloscope for waveform shape, timing, ripple or high-speed communication faults.

Which Multimeter Mistakes Should You Avoid?

  • Measuring voltage with the red lead in a current jack: this can place a near-short across the source.
  • Measuring current in parallel: current must be measured in series unless a clamp or external shunt is used.
  • Testing resistance or continuity on a powered circuit: external voltage can invalidate the reading and damage the meter.
  • Ignoring stored energy: capacitors can retain hazardous or damaging voltage after power is removed.
  • Assuming every beep means a perfect connection: read the resistance and know the meter’s threshold.
  • Using the wrong AC/DC function or unit: millivolts, volts, milliamps and amps are not interchangeable.
  • Probing fine-pitch pads with long exposed tips: an accidental bridge can create a new fault.
  • Using an unsuitable meter for mains work: the CAT category, voltage rating, leads and input protection must match the environment.

FAQ About How to Use a Multimeter

1. How Do I Know What to Set My Multimeter To?

Match the function to the quantity: V for voltage, Ω for resistance, continuity for a low-resistance path, diode mode for junction forward drop, and A/mA/µA for current. Then select AC or DC and a range above the expected value. If the expected value is unknown on a manual-ranging meter, start high.

2. What Does OL Mean on a Multimeter?

In resistance or continuity mode, OL usually means the path is open or above the selected range. In manual range mode, try a higher range before declaring an open circuit. In voltage or current mode, an over-range indication means the input exceeds the selected range and the test should be stopped.

3. Can a Multimeter Test Every PCB Component?

No. It can check accessible DC voltages, resistance, continuity and some diode junctions, but in-circuit parallel paths can hide the true component value. It also cannot evaluate high-speed waveforms, firmware behavior or many intermittent faults. Use the schematic and the appropriate instrument for the suspected failure.

4. Why Does a Continuity Test Beep on Both Probe Directions?

A metallic path is not polarized, so a normal wire, fuse or trace should show similar resistance in both directions. Semiconductor networks may conduct differently by direction. If the meter beeps both ways across a diode, isolate it before deciding it is shorted because other circuit paths may be responsible.

Conclusion

The central rule for how to use a multimeter is to match the mode, terminal and circuit connection before probing. Measure voltage in parallel, measure current in series, and remove power before resistance, continuity or diode tests. On circuit boards, interpret each result against the schematic and remember that a handheld meter cannot expose every hidden or dynamic fault.

Multimeter, AOI and X-ray checks used for PCB assembly quality control

In production, EBest Circuit (Best Technology) combines bare-board flying-probe or universal electrical testing with open/short checks, while assembled PCB assembly can be inspected through 3D SPI, AOI, X-ray and functional testing as applicable. These methods verify more of the manufacturing and assembly process than a bench multimeter alone. For PCB or PCBA manufacturing support, contact sales@bestpcbs.com.