

To compare phase noise, start with the carrier frequency, the offset range and the measurement conditions—not one impressive number. A clock with lower noise at one offset can still produce more integrated timing uncertainty in the band your receiver or converter actually uses.
This guide explains how to read a phase-noise plot, convert a defined noise spectrum into RMS jitter, and decide whether a measurement represents the oscillator or the instrument. The calculations are explicitly hypothetical; they are not measurements of a particular oscillator, PCB or customer’s product.
What is phase noise?
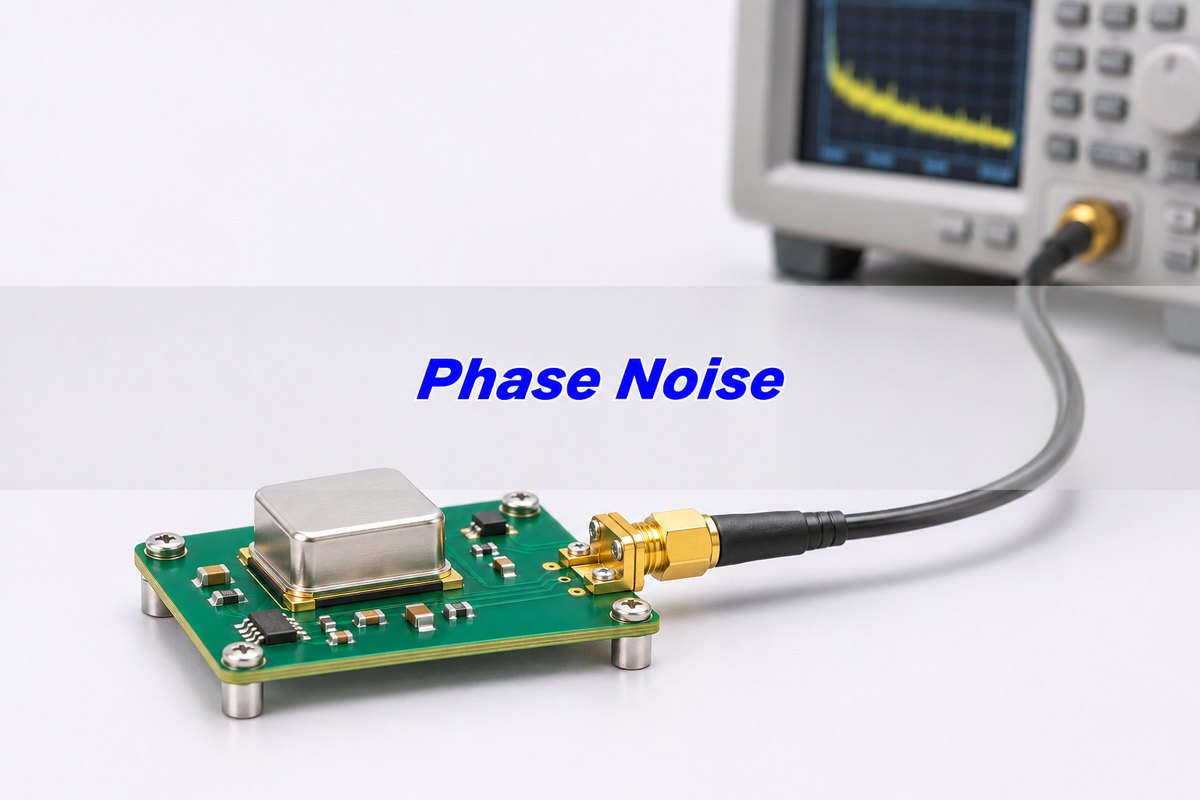
Phase noise is short-term fluctuation in a signal’s phase. An ideal carrier would have perfectly predictable phase progression. A real oscillator departs from it, spreading noise around the carrier in the frequency domain and moving signal timing in the time domain.
A useful model is v(t) = A cos[2πf0t + φ(t)]. Here f0 is the carrier frequency and φ(t) is the phase fluctuation. This model separates phase variation from amplitude variation; a real measurement can contain both. Do not label every visible spectral skirt “pure phase noise” without checking the measurement method.
The practical question is where that noise hurts. A sampling clock changes when an ADC captures a signal. A receiver’s local oscillator can spread energy from nearby interference into the wanted channel. A PLL reshapes different noise contributions. Those are related effects, but their acceptance conditions are not interchangeable.
Phase noise units: what does dBc/Hz mean?
Single-sideband phase noise L(f) is noise power in a 1 Hz bandwidth at an offset f from the carrier, expressed relative to carrier power. Its usual unit is dBc/Hz. More-negative values mean lower noise density under the same conditions.
For example, “−140 dBc/Hz at 100 kHz offset, 100 MHz carrier” contains three essential facts. The carrier is at 100 MHz; the noise is examined 100 kHz away from it; the result is normalized to 1 Hz. It does not mean that the oscillator itself runs at 100 kHz or has −140 dBm of total noise.
Discrete spurs are different from a continuous noise density. Report a spur’s relative integrated power in dBc and its offset, and say whether the instrument includes it in integrated jitter. Copying a spur peak from a dBc/Hz display without knowing its bandwidth handling can create a misleading comparison.
Phase noise plot: read the offsets before the headline
The horizontal axis is usually logarithmic offset frequency, not the carrier frequency. The vertical axis is noise density. Read the conditions first, then examine close-in behavior, wider-offset noise and narrow spurs separately.
A better value at 10 kHz does not establish a better value at 1 MHz. If two curves cross, the application determines which region matters. Also check whether the plot represents a free-running oscillator, a locked PLL, an output buffer or an entire clock path. A datasheet’s best operating mode may not be your selected mode.
Before choosing a part, request the relevant plot or data table at your output frequency, supply, output format and loading. A single “typical jitter” value with no integration limits is insufficient to reproduce the result.
Phase noise vs jitter: which evidence do you need?
Phase noise retains information about where fluctuations occur in frequency. Integrated RMS jitter compresses a specified part of that spectrum into one timing number. Neither is automatically the better specification; they answer different questions.
| Decision | Phase-noise evidence | Timing evidence |
| Compare RF local oscillators | Noise at offsets related to channel separation and interference, plus spur limits | A single integrated number can hide the important offset region |
| Budget sampling-clock uncertainty | Integrate the relevant spectrum with the clock path’s filtering understood | RMS clock jitter can enter a qualified converter noise calculation |
| Find edge-to-edge timing behavior | Useful background, but not a substitute for all time-domain metrics | Measure the specified TIE, period or cycle-to-cycle quantity |
| Compare supplier claims | Match carrier, offsets, output mode and spur treatment | Match integration limits and definition before comparing RMS values |
Use the jitter measurement guide for the differences between TIE, period and cycle-to-cycle measurements. Converting phase noise to one RMS value does not make those quantities identical.
Phase noise to jitter: a calculation you can check
For small phase fluctuations with a consistently defined single-sideband spectrum, convert dB values to linear power before integrating:
σφ² = 2 ∫fLfH 10L(f)/10 df, then σt = σφ / (2πf0).
The factor 2 accounts for the two sidebands under this convention. Integrating dBc/Hz values directly, omitting the factor, or using the offset frequency in place of the carrier produces the wrong result.
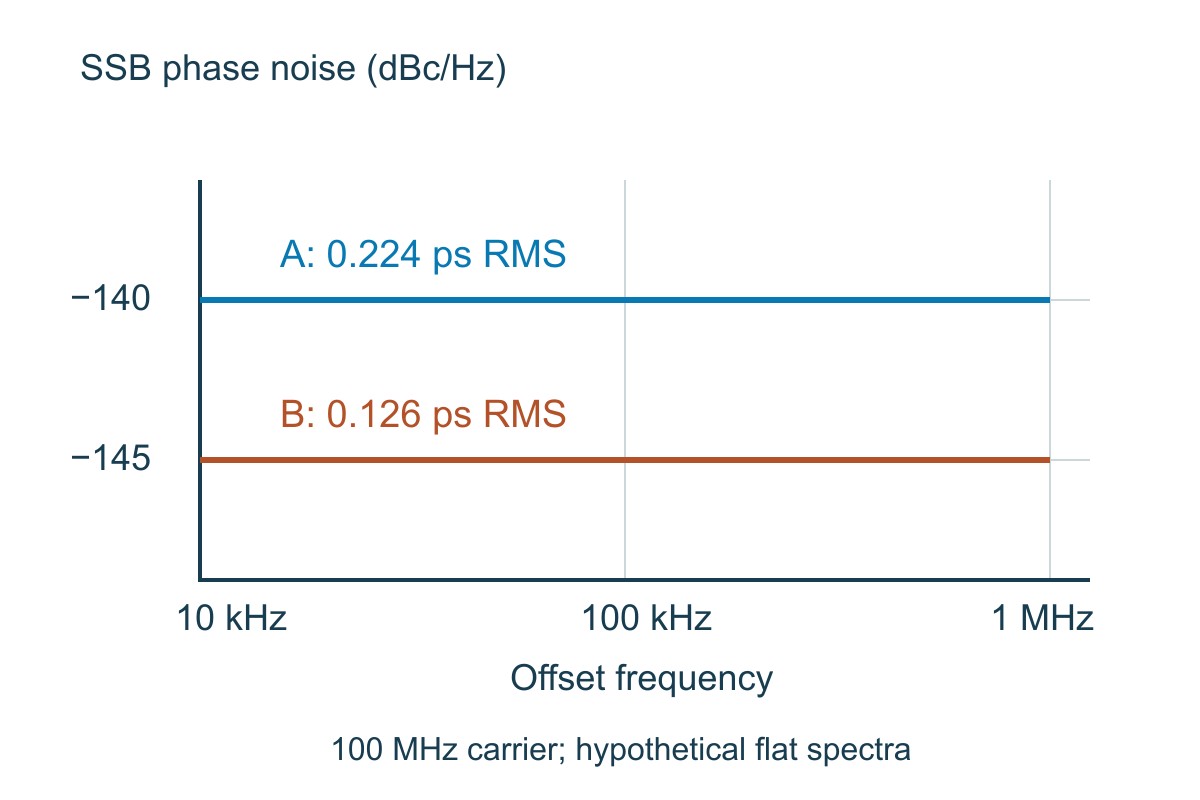
Worked hypothetical example: let f0 = 100 MHz, L(f) = −140 dBc/Hz throughout 10 kHz–1 MHz, with no discrete spurs included. The bandwidth is 990,000 Hz. The linear density is 10−14/Hz, so phase variance is 2 × 10−14 × 990,000 = 1.98 × 10⁻⁸ rad². RMS phase is 0.000140712 rad; RMS time is 0.223951 ps, or approximately 224 fs.
| Input or result | Example A | Example B |
| Carrier / offset band | 100 MHz / 10 kHz–1 MHz | 100 MHz / 10 kHz–1 MHz |
| Assumed flat SSB density | −140 dBc/Hz | −145 dBc/Hz |
| Calculated RMS time | 0.224 ps | 0.126 ps |
| What the result covers | Only the specified hypothetical noise band | The same band and assumptions, allowing a fair comparison |
B’s 5 dB lower density reduces time RMS by a factor of 10−5/20 ≈ 0.562, not by “5 ps.” For a real sloping spectrum, integrate the actual linear data or a justified piecewise model. Do not stretch this flat example across an unmeasured band.
Choose fL and fH from the system requirement and transfer behavior. There is no universal “10 kHz–1 MHz” acceptance band. A tracking loop or clock input can weight noise differently; apply the appropriate transfer function when a rectangular integration window is not an adequate model.
Phase noise measurement with spectrum analyzer: check the floor
A direct spectrum-analyzer measurement compares nearby noise with the carrier and normalizes the result to bandwidth. Its usable range depends on dynamic range, analyzer local-oscillator noise and measurement settings. An attractive trace is not proof that those contributions are negligible.
Check input power, attenuation, reference level, offset range and the instrument’s noise-normalization method. Use the manufacturer’s phase-noise procedure rather than subtracting an arbitrary resolution-bandwidth number from a screen marker. Amplitude noise or overload can also invalidate a phase-only interpretation.
Here is a simplified illustration of floor contamination: independent noise powers of −140 and −150 dBc/Hz sum to −139.586 dBc/Hz, about 0.414 dB above the first contribution. Two equal −140 dBc/Hz contributions sum to −136.990 dBc/Hz, about 3.010 dB higher. This is a power-addition example, not a universal correction formula for every phase-noise instrument.
If the DUT result follows the analyzer floor, change to a validated lower-floor method or report the measurement limitation. Do not subtract almost equal traces and present the unstable difference as an accurate low-noise oscillator result.
Phase noise measurement cross correlation: what it removes
A two-channel phase-noise system observes the same DUT through two measurement paths. Cross-correlation can reduce uncorrelated noise added by the channels while retaining the DUT’s common contribution. More processing can improve sensitivity, at the cost of measurement time.
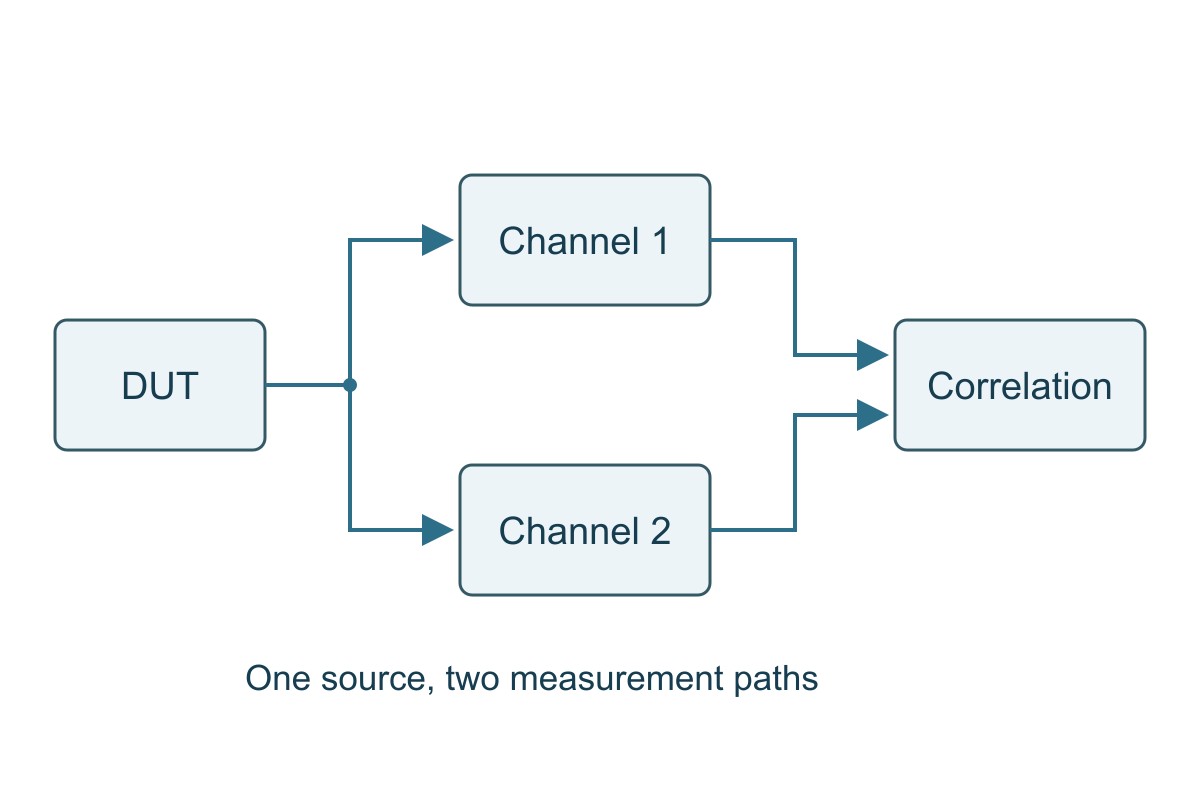
It does not remove real DUT noise. Nor does it automatically reject shared interference, common supply coupling or correlated errors. If a line remains while channel noise falls, investigate its origin rather than assuming enough averaging will erase it.
Record the correlation or averaging configuration with the result. Comparing a long, low-floor acquisition with a quick preliminary sweep without noting the difference can make an instrument setting look like a product improvement.
Where phase noise matters: applications and acceptance checks
ADC sampling clocks
The clock sets sampling instants; uncertainty becomes signal error. Use the noise delivered to the actual converter clock input, with the relevant filtering and bandwidth. For a sine-wave input, the jitter-only ceiling is SNR = −20 log10(2πfsignalσt).
Using example A’s band-limited clock contribution only, a 20 MHz input gives approximately 91.0 dB; a 100 MHz input gives approximately 77.0 dB. These are not complete ADC SNR predictions: aperture jitter, other clock noise outside the example band, distortion and converter noise remain. Verify the delivered clock and the converter spectrum under the intended input frequency, amplitude and configuration.
RF receiver local oscillators
The LO translates signals to another frequency. Noise around it can transfer interference energy into the wanted band, so the important offsets relate to the channel and blocker arrangement. Preserve wanted-channel sensitivity; control the noise contribution around relevant blocker separations, not merely the integrated number printed on a clock brochure.
For an illustrative blocker 1 MHz from the wanted signal, inspect the LO spectrum around the relevant 1 MHz offset and apply the receiver’s actual bandwidth and conversion behavior. A single spot value still does not establish total in-channel noise. Verify sensitivity or error performance with the specified wanted signal and blocker present, then repeat the comparison with identical receiver gain and bandwidth.
PLLs and clock-distribution boards
A PLL is not an all-purpose noise eraser. Reference-path noise and VCO noise have different transfer responses; changing loop bandwidth trades their contributions. An output buffer and the assembled clock path can add further noise.
Compare spectra before and after the PLL or buffer at the same carrier and load, and integrate with the system’s required weighting. Then verify lock behavior, output mode and relevant timing limits. If the operating mode uses deliberate spread-spectrum modulation, treat that separately; spread spectrum clocking is not equivalent to a lower random phase-noise floor.
Reducing phase noise: use a comparison worksheet
Begin with a repeatable baseline. Record output frequency, supply condition, load, temperature, measurement path, offsets, spur handling and integration settings. Change one suspected contributor at a time; otherwise a better trace does not tell you which change helped.
| Observed evidence | Controlled check | Decision and next step |
| A narrow line appears near a switching-related offset | Compare supply spectra and a verified alternate supply condition without changing other settings | If both move together, investigate coupling; correlation alone is not final proof |
| PLL output is worse in part of the band | Compare reference, VCO model and configured loop response | Revisit loop trade-offs; do not simply narrow bandwidth on every design |
| Noise increases after a buffer or PCB path | Match output format, loading and measurement reference plane before comparing | Separate path-added noise from changed termination or analyzer settings |
| Result sits on the instrument floor | Check a qualified lower-floor acquisition method | Report a limit or repeat; do not release a claimed improvement without resolution |
Example use: if a line appears at a suspected supply-related offset, record its offset and relative power, compare a controlled supply change, and repeat the original condition. If the line does not reproduce, do not close the investigation with “better decoupling fixed it.” Save the spectra and conditions that support the conclusion.
For acceptance, require the specified spot-noise mask, integrated jitter band and spur limits at the relevant clock output. A PCB fabrication pass alone cannot prove a populated oscillator circuit’s phase-noise performance. Agree the functional RF or clock test separately from bare-board acceptance.
Phase Noise FAQs
Is −140 dBc/Hz better than −130 dBc/Hz?
At the same carrier, offset and conditions, it is 10 dB lower noise density. It does not establish that the entire spectrum or integrated jitter is better.
Why does the integration bandwidth change jitter?
The integral counts noise within the selected band. Changing its limits changes the included power. Use the application’s required band or transfer weighting, and state it with the result.
Can I integrate phase noise in dB directly?
No. Convert L(f) to linear power density, integrate over frequency, apply the SSB convention and convert RMS phase to time using carrier frequency.
What RMS jitter does the example −140 dBc/Hz spectrum produce?
Approximately 0.224 ps for a flat spectrum from 10 kHz to 1 MHz at a 100 MHz carrier, excluding spurs. Different limits or spectrum shape give a different answer.
Does the ADC calculation use the clock frequency as the input frequency?
No. The jitter-only SNR formula uses the analog input signal frequency. The phase-to-time conversion separately uses the clock carrier frequency.
Should spurs be included in phase-noise-derived jitter?
State the requirement and the instrument’s treatment. Report discrete spurs separately in dBc and identify whether the integrated result includes them; do not silently compare different conventions.
Does cross-correlation remove the oscillator’s noise?
No. It helps reduce uncorrelated measurement-channel contributions. Noise common to the paths, including the DUT contribution, remains.
Can a better PCB layout guarantee lower phase noise?
No. Layout can affect coupling, supply integrity and clock-path behavior, but the oscillator, PLL, buffers and test setup also matter. Demonstrate improvement with matched measurements rather than a layout-only claim.
Technical References
- Rohde & Schwarz: measuring phase noise — units and spectral interpretation.
- Analog Devices MT-008 — phase-noise-to-jitter conversion.
- Analog Devices MT-007 — aperture jitter and converter SNR.
- SiTime AN10062 — measurement methods, cross-correlation and spurs.
- Keysight: methods and instruments for phase-noise measurement — direct measurement limitations.
- Texas Instruments SSZTBK6 — PLL noise contributions and loop behavior.
Custom RF PCB Manufacturing with Prototype and Assembly Support
Need a custom RF PCB or assembled clock board? EBest Circuit supports RF PCB fabrication, prototype builds and PCB assembly. File review connects your material and stackup requirements with the actual manufacturing and assembly scope, helping avoid a bare-board quotation that leaves the populated-board requirements unresolved.
Send your Gerber or ODB++ files, stackup, material requirements, impedance targets and quantity to sales@bestpcbs.com for a quotation. For PCBA, add the BOM, placement data and required functional test. Tell us which RF or clock measurements the project needs so the test scope can be evaluated explicitly—without assuming that a fabrication check guarantees phase-noise performance.
You may also like


Tags: Clock Design, Phase Noise, RF PCB, Signal Integrity