

To check a passive PCB interconnect, compute the largest singular value of its full complex S matrix at each frequency, using a consistent power-normalized port basis. A value above 1 means the data predicts more outgoing power than incoming for at least one combination of incident waves. Looking only at S21—or even at every S entry separately—can miss it. Find the first file or processing step that shows the problem before using passivity enforcement.
What Is an S-Parameter Passivity Check?
For a linear passive interconnect, no incident-wave combination can produce more total outgoing power than the incoming waves provide. In a power-normalized representation, the complex outgoing vector b equals the full matrix S times the incident vector a. The sum of squared wave magnitudes gives power in that basis. The upper bound is therefore on the ratio of the two vector norms, not on one plotted transmission trace.
With positive real reference resistances and the corresponding power normalization, check that the largest singular value σmax(S) is at most 1. Equivalently, the largest eigenvalue of SHS, where H denotes complex conjugate transpose, is at most 1. A value equal to 1 can be legitimate for a lossless mode. This article assumes positive real port references; if your tool uses complex impedances or a different wave definition, use the correct power metric or validated conversion before applying this test.
Singular Value Decomposition: A Two-Port Example You Can Check
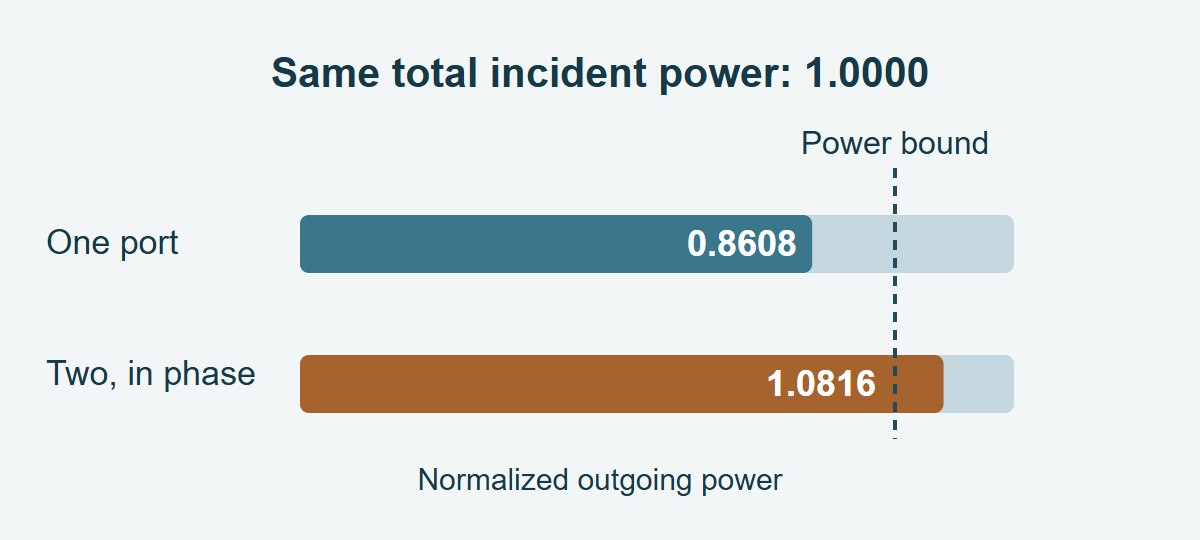
At one frequency, take a real-valued example with S11 = S22 = 0.12 and S21 = S12 = 0.92. For a unit input at either port alone with the other port matched, total outgoing normalized power is 0.12² + 0.92² = 0.8608. That single-port test passes in either direction, and every element magnitude is below 1.
Now drive the ports in phase, sharing one unit of total incident power equally. Each incident wave has amplitude 1/√2. The two outgoing amplitudes are each (0.12 + 0.92)/√2. Their total normalized outgoing power is 1.0816. The largest singular value is 1.04, and its square gives the worst-case power ratio. The opposite-phase mode has singular value 0.80. The numbers are a deliberately nonpassive example, not measured coupon data.
Touchstone File: Verify the Basis Before Doing the Math
Read the actual complex values, not an S21 magnitude plot or an export with phase removed. Verify units, data encoding, file version, port order, reference resistances and whether the data is single-ended or mixed mode. A four-port file is not automatically a differential file. Do not assemble a matrix by copying an assumed order of S11, S12, S21 and S22 from text: use a compatible Touchstone reader and confirm the imported matrix against known values.
Run the check before and after any required conversion. The S-parameter renormalization guide explains how to carry the full matrix to a new reference. Correct renormalization of a passive network into another positive real power-normalized basis should not invent physical gain. A warning that first appears after import or conversion deserves a check on wave definitions, numerical conditioning and metadata.
S-Parameter Passivity vs. Causality and Reciprocity
These checks answer different questions. A file can pass one and fail another. Use only the checks relevant to the network and its intended model: an active amplifier is not a passive coupon, and a passive network need not be reciprocal.
| Check | Question it answers | What a pass does not prove |
| Passivity | Does any incident-wave combination yield excess outgoing power? | Correct port mapping, fit accuracy or causality |
| Causality | Is the response zero before excitation, with the defined planes? | Power consistency; finite-band transforms can also create apparent early ringing |
| Reciprocity | Do exchanged transmission terms agree where reciprocity is expected? | Passivity or identical reflections at both ports |
Nonpassive S-Parameters: Find Which Data Step Introduced the Warning
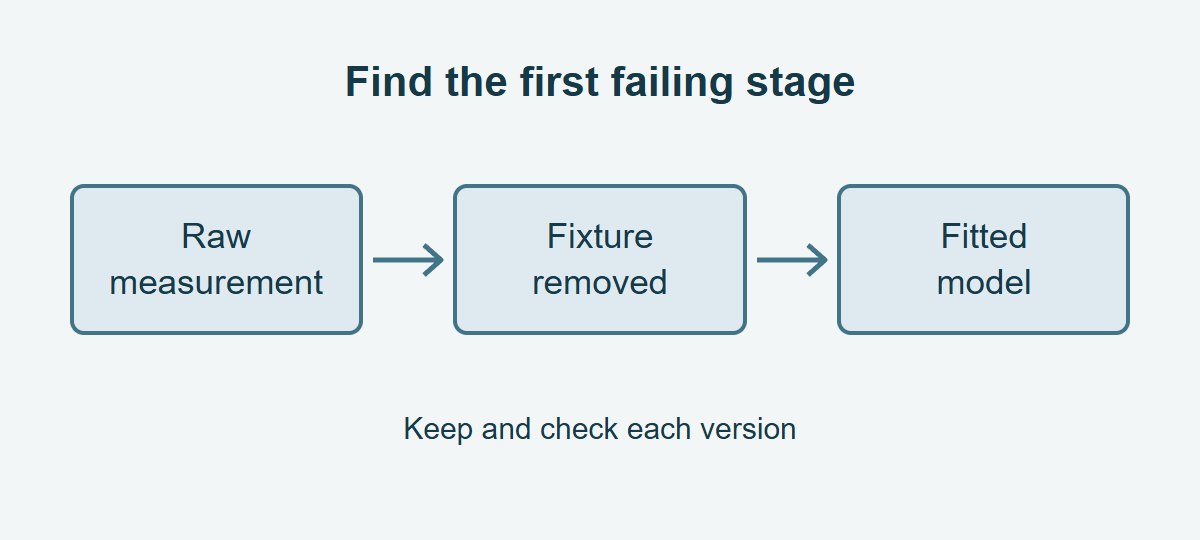
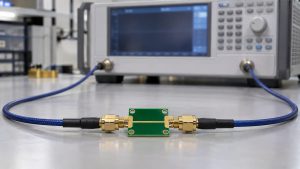
Keep three versions: the raw measurement, the de-embedded or converted data, and the fitted model. Plot or record the worst singular value against frequency for each. If the raw passive witness itself fails, recheck VNA calibration, cable stability, connection repeatability and raw data import. If only the result after fixture removal fails, review reference planes, fixture equivalence and residuals; small errors can become more significant around low-transmission or poorly conditioned regions.
If the imported samples pass but the fitted model fails, examine the fit over its intended use range, not just at the measured points. A sparse grid can miss a violation between samples, and a small average fit error does not prove passivity. For an actual PCB interconnect measurement, use the agreed verification method. IEEE Std 370-2020 concerns high-frequency electrical interconnect characterization up to 50 GHz; its public scope is not a blanket acceptance rule for every model or a numerical tolerance for this calculation.
Passivity Enforcement: Correct a Model Without Hiding Bad Data
Use enforcement only after reviewing the measurement and identifying the model problem. Save the unmodified dataset. Apply the tool’s appropriate passive fitting or model-repair method and preserve it separately from the measurement. Do not independently set every term above 0 dB to 0 dB; entries that individually pass can still violate the joint power constraint.
Check the repaired model continuously with an applicable model-level test when available, and compare insertion loss, return loss, coupled terms and response timing against the original in the decision band. Quantify the change where the design has the least margin, not just a global residual. If the correction changes a notch or consumes the error budget, refit or remeasure instead of calling it a successful repair. A software tolerance handles numerical or QA decisions; it does not change the physical bound of 1.
S-Parameter Applications: What to Check Before Releasing the File
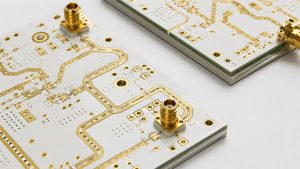
RF PCB filter or test coupon: Apply the matrix test at the specified DUT planes across the required band. Compare the raw and fixture-removed versions, and verify that the filter’s wanted passband loss and stopband features were not moved by a correction beyond the agreed error budget.
Differential serial channel: Confirm all four physical port assignments, the pairing and the power normalization before converting to mixed mode. Test the whole represented network, not just the differential transmission block. For transient use, also check causality, the intended delay and any material regression in the channel response.
Vendor model handoff: Keep the original Touchstone file and any fitted model as separate artifacts. Reopen both in the recipient’s tool, confirm the frequency range and reference resistances, and rerun the checks used to make the release decision. Do not present a repaired fit as raw VNA data.
S-Parameter Passivity Check Report: Record the First Failure
Keep a short record of each stage and the band the model is intended to cover. The example below shows how to make a hold decision without inventing a universal limit for measurement uncertainty.
| Record field | What to check or write |
| Files, port map, planes and reference basis | List raw, processed and model versions; record frequency units, ports and real reference resistances |
| Worst sample or failing frequency band | Illustrative sample: 1.04 at 5 GHz in the processed file; power ratio 1.0816. Keep the complex matrix and identify which stage first shows the excess |
| Disposition and evidence | Hold the suspect file for review; include raw witness, correction delta in the critical band, fit coverage and verification rerun before release |
S-Parameter Passivity Check FAQs
Can negative S21 in dB still come from a nonpassive file?
Yes. S21 measures one path under one drive and termination condition. Other outgoing waves and combined input modes can make the full matrix fail.
Is a singular value of 1 automatically bad?
No. A lossless mode can legitimately have a value of 1. Small excesses near the bound require checking the full measurement and numerical uncertainty before drawing a conclusion.
Can I check passivity without phase?
Not generally. The worst-case input depends on the complex relationships among the matrix entries. Magnitudes alone do not preserve those relationships.
Does a 50 Ω reference mean all test loads must be exactly 50 Ω?
The reference determines the wave normalization, not the actual impedance of every connected load. Keep the physical termination and mathematical reference documented separately.
Why can a fit fail when all measured points pass?
The fit is a different mathematical model. It may overshoot between samples or become nonpassive in an unmeasured range despite matching the table closely at its sample frequencies.
Can an active amplifier legitimately fail this test?
Yes. An amplifier can supply energy from its bias source. Do not force its intended active model to meet an unconditional passive network constraint.
Is a successful transient simulation enough to accept the model?
No. One setup may not excite modes or frequencies that reveal a problem. Check the model, its applicable bandwidth and the actual transient response against the intended use.
Should I overwrite a vendor file after enforcing passivity?
No. Retain the original and save the corrected version separately, with a processing record and comparison at the frequencies that matter to the design.
Technical References
- Anritsu measurement guide: Enforced Passivity and Causality — S-matrix norm and unmodified comparison.
- Ansys Circuit: checking causality, passivity and fit error — data versus model behavior.
- IBIS Open Forum Touchstone 2.1 specification — data encoding, ordering and references.
- IEEE Std 370-2020 — high-frequency PCB and related interconnect characterization scope.
Custom RF PCBs With Stackup and Coupon Review Before Fabrication
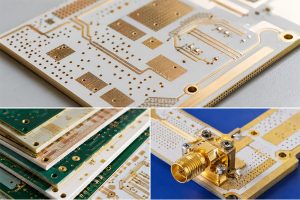
Send EBest Circuit your fabrication files, stackup and transmission-line requirements before ordering. Mark your port locations, controlled-impedance targets and any coupon or measurement handoff you need so those requirements can be reviewed with the build. Email sales@bestpcbs.com to request a custom RF PCB quote.
You may also like


Tags: passivity enforcement, PCB interconnect modeling, S Parameters, S-parameter passivity check