





The Huray roughness model represents copper surface texture using an idealized nodule geometry to modify conductor surface impedance. In Ansys HFSS 3D Layout, its inputs include a nodule radius and a dimensionless Hall-Huray surface ratio. They are not interchangeable with a foil datasheet’s Rz roughness height.
This guide follows a hypothetical RF microstrip coupon from material selection to simulation review. Its useful output is a traceable input record: which copper face each value describes, where that value came from, which solver convention was used, and how the model was checked. It does not supply universal roughness settings for an unspecified PCB.
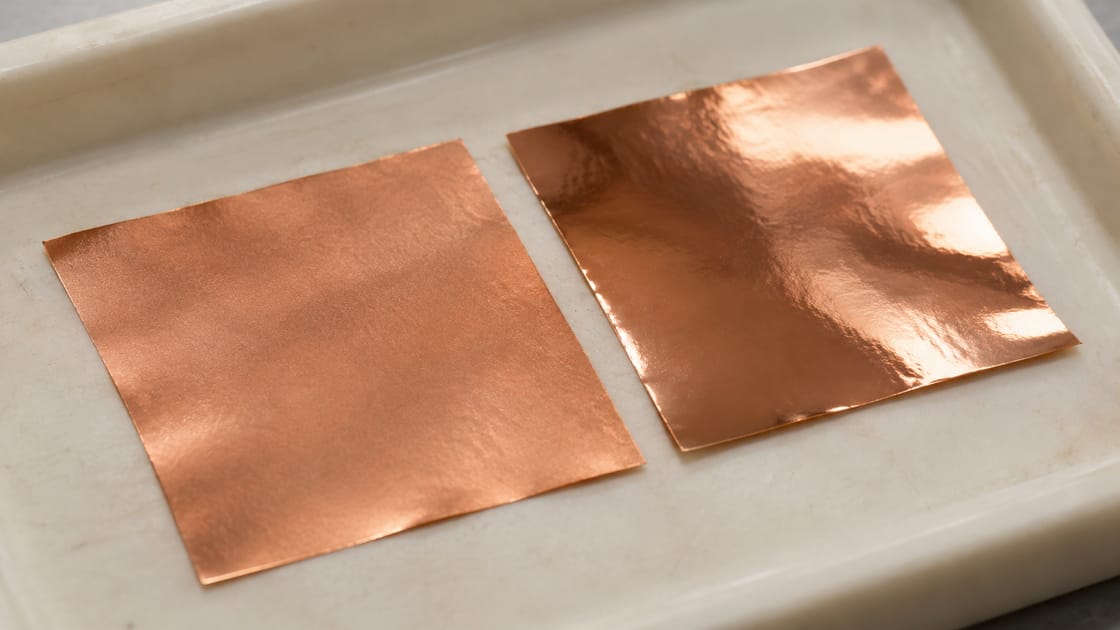
What the Huray Model Does to a PCB Simulation
The model accounts for electrical consequences of surface texture without requiring the mesh to reproduce every microscopic feature. A smooth-copper calculation and a roughness-enabled calculation can therefore differ even though the drawn trace geometry is unchanged.
Ansys documents a causal modification that also handles phase effects, rather than only a real-valued loss increase. See its Huray Surface Roughness Model documentation, 2025 R2. Record the actual implementation and version; the name “Huray” alone is not a complete description of a simulation setup.
Why Copper Texture Matters More as Frequency Rises
At increasing frequency, skin effect concentrates current nearer conductor surfaces, making the condition of those surfaces relevant to loss. Skin depth is the characteristic penetration distance, not the physical foil thickness. That is why a thick copper layer can still need a surface model.
For the RF coupon, first define the operating frequency range and acceptable channel behavior. Do not ask whether roughness matters in isolation from frequency, geometry and field distribution. The current in both the signal conductor and its return path matters. A visual inspection of a shiny top surface does not characterize the less visible copper-dielectric interface.
Key Huray Parameters and Their Units
Keep physical dimensions, dimensionless factors and software defaults in separate fields. This avoids a numerically plausible entry acquiring an unsupported physical meaning.
| Input | Unit | Interpretation |
| Nodule radius | Length, e.g. µm | Radius in the idealized surface model |
| Hall-Huray ratio | None | Surface-area relationship under the model convention |
| Rz or Rq | Length | Measured profile statistic, not automatically either input above |
| Conductivity | S/m | Conductor property, separate from roughness |
| Frequency | Hz and stated sweep | Range over which the response is evaluated |
The current PyEDB StackupLayer API reference shows default Huray inputs of 0.5 µm and 2.9. These are API defaults, not measured values for your copper. Explicitly supply reviewed inputs and record their source rather than accepting a default because the solver runs.
Why Rz Cannot Simply Be Pasted into Nodule Radius
Rz describes a surface-profile measurement, while nodule radius describes the geometry assumed by the model. A numerical conversion requires an identified method and assumptions; equal units do not make two quantities equivalent.
A Cannonball-Huray derivation is one published route for estimating model inputs from foil roughness information. It introduces a close-packed-sphere assumption rather than proving that a real copper surface consists of identical spheres. Use the method as a documented estimate within its limits, not as an exact measurement. Keep the original roughness metric, measurement convention and derived parameters together so another engineer can reproduce the choice.
Huray vs Groiss and a Smooth-Copper Baseline
Compare models as modeling choices, not as three interchangeable fields accepting the same number.
| Choice | Role | Review caution |
| Smooth copper | Diagnostic baseline | Not a claim that the physical copper is smooth |
| Groiss in Ansys 2025 R2 | Legacy roughness correction | Frequency-domain limitation documented by Ansys |
| Huray in Ansys 2025 R2 | Causal roughness model | Requires radius and surface-ratio convention |
| Cannonball-derived inputs | Parameter-estimation approach | Not a separate measurement of the finished interface |
These statements refer to the named Ansys implementation. The layer roughness settings documentation explains its available choices. Other solvers may use different names, conventions or corrections, so do not translate settings solely by matching menu labels.
Map Model Values to the Correct Copper Faces
Assign values by physical interface, not merely by a layer name such as “top copper.” A microstrip trace has a face toward the dielectric, a face away from it and etched sidewalls. Its reference plane also participates in the electromagnetic problem.
Draw a simple face map for the hypothetical coupon and identify which supplied value belongs to each interface. Ansys permits separate top, bottom and side settings. “Set all” is a convenience command, not evidence that the three physical surfaces are identical. If only one face is characterized, record the uncertainty rather than quietly copying it everywhere.
Ask for Data That Matches the Manufactured Interface
Request foil identity, side identity, roughness metric and processing context together. The laminate name alone may not identify the exact copper supplied or the state of the surface after subsequent fabrication.
For the coupon, distinguish incoming foil data from information representing the finished stackup. Ask what treatment or processing stage the value describes and whether the modeled face corresponds to it. Keep an input marked “supplier data” separate from one derived by an engineer or fitted to a coupon. Our related microstrip PCB guide provides the wider geometry and reference-plane context.
Build a Sensitivity Study Before Claiming a Prediction
A sensitivity study asks how much the result depends on uncertain inputs; it does not establish which input is true. For the hypothetical RF coupon, hold the verified trace geometry, dielectric model and ports fixed while comparing a smooth baseline with separately documented candidate roughness sets.
- Save the baseline model and complete input record.
- Change only the selected roughness parameters for each comparison.
- Review insertion loss and phase across the same frequency sweep.
- Mark which candidates are measured, supplied, derived or hypothetical.
- Investigate whether the resulting spread changes the design decision.
No numerical outcome is implied here. If the acceptable design depends on one unverified roughness setting, the next action is better characterization, not a more confident caption on the plot.
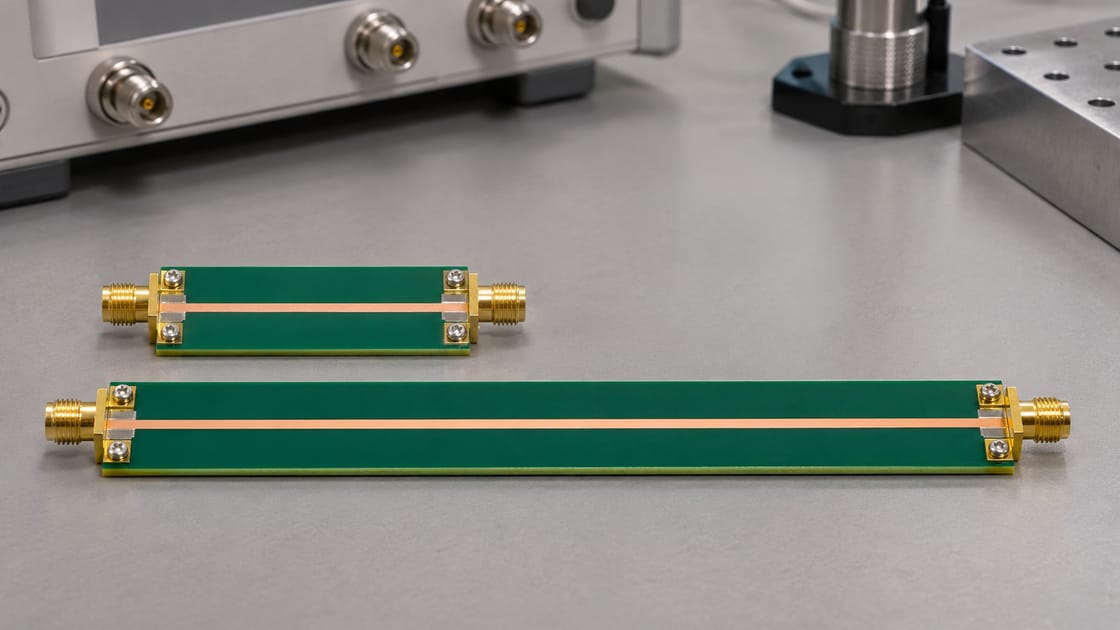
Use Coupon Measurements Without Hiding Other Errors
Measurement comparison must use a defined reference plane and a controlled geometry before it can usefully constrain a material model. A connector transition, calibration issue or incorrect trace width can otherwise be mistaken for roughness loss.
Two line lengths can support a suitable extraction method, but subtracting two arbitrary S21 magnitudes is not automatically a rigorous de-embedding procedure. Check the chosen method’s assumptions, matching, fixture repeatability and frequency behavior. Use independent geometry and dielectric information where possible. Save the measured data, extraction steps and model version so the apparent agreement can be reproduced.
Do Not Fit Roughness and Dielectric Loss Blindly
A good-looking total-loss fit does not prove that the separate loss mechanisms were identified correctly. If both dielectric loss and roughness are freely adjusted, different parameter combinations may explain similar attenuation over a limited band.
Constrain one mechanism with independent evidence before interpreting the other. Review phase as well as loss, and test against a different length or suitable validation structure not used for fitting. If changing geometry or reference-plane assumptions destroys the fit, investigate those assumptions first. Describe a fitted parameter set as a model effective for its validation conditions, not as a universal copper material certificate.
Check Plating, Vias and Return Surfaces Separately
Do not use a roughness factor as a catch-all correction for every conductor-related effect. Surface finishes, plated conductors, etched geometry, vias and reference planes need their own modeling decisions and appropriate evidence.
For the RF coupon, write down which metal stack and interfaces the solver actually represents. If a later design adds a different finish or via transition, revisit the model instead of copying the coupon’s fit unchanged. Applying a trace-surface setting to every conductor is not automatically conservative: it may misrepresent where the fields and currents are concentrated.
Release a Traceable Roughness Model, Not Just a Screenshot
The release record should let another engineer rebuild the same assumptions and identify what remains uncertain.
- Solver, version, roughness model and unit convention.
- Material and foil identity with source document revision.
- Face-by-face assignment and treatment state.
- Radius and ratio, labeled supplied, measured, derived or fitted.
- Geometry, frequency range, dielectric model and port setup.
- Validation data, limits and triggers for rechecking substitutions.
The practical decision is whether that evidence supports the design margin. A completed simulation proves that a model was solved, not that the finished PCB has been validated.
FAQ
Can I use the same Huray values in two different solvers?
Only after checking each solver’s parameter definitions, units, causal treatment and surface assignments. Similar field names do not establish equivalent implementations. Reproduce a simple controlled structure and compare the expected behavior before transferring a production model. Keep the original source and conversion assumptions with both projects rather than copying two unexplained numbers.
Does a lower foil Rz guarantee lower finished channel loss?
No. It is one potentially relevant input, not a channel-level guarantee. Dielectric loss, geometry, copper processing, finishes and transitions can also affect the measured response. Compare matched constructions and methods before attributing the difference to foil texture. Do not replace a complete channel requirement with one roughness statistic on a purchase order.
Should I increase mesh density until the microscopic texture appears?
Not as a substitute for understanding the selected surface model. A model-based correction represents effects that are not explicitly drawn as physical nodules. Follow the solver’s meshing and boundary guidance for the actual structure, then demonstrate convergence. Increasing computational effort does not repair unsupported material parameters or an incorrect face assignment.
Is a fitted roughness value valid for a different surface finish?
Not automatically. The fit may include effects that were not separately identified in the original coupon. A changed finish or metal stack can invalidate that interpretation. Review what the original model represented and repeat the relevant validation rather than treating the fitted value as an intrinsic property independent of manufacturing conditions.
Why can a model match loss but miss resonance frequency?
A loss match does not prove that phase delay and stored-energy behavior were modeled correctly. Geometry, dielectric dispersion, roughness implementation and transitions may need review. Use suitable phase or resonant measurements as additional constraints. Do not change dielectric constant solely to hide a mismatch before checking the physical construction and reference planes.
Can I use a single model for all fabrication lots?
Use it only within the construction and variation envelope that your evidence supports. A material substitution, changed foil treatment or altered fabrication process should trigger review. Define that envelope in the release record and ask how the relevant material identity is controlled. One successful coupon does not establish unlimited lot-to-lot equivalence.
Does the model predict DC resistance accurately from roughness alone?
No. DC resistance still depends on conductor dimensions, conductivity, temperature and the actual current path. A high-frequency surface correction is not a replacement for those inputs. Check the solver’s low-frequency treatment and compare against an appropriate baseline rather than interpreting a Huray radius as a standalone resistance specification.
What should I do when the supplier provides only Rz?
Ask which face and measurement method the value describes, then request a supported model parameter set if available. If you use a published derivation, record its assumptions and label the result as estimated. Carry the uncertainty into sensitivity and validation work; do not relabel the original Rz value as a measured sphere radius.
Technical References
- Bert Simonovich: Practical Method for Modeling Conductor Surface Roughness Using Close Packing of Equal Spheres, original method discussion and validation context.
- Altium OnTrack interview: Copper Roughness and Signal Integrity, discussion with the model-method developer.
For a Best Technology RF PCB enquiry, send the stackup, foil requirements, simulation assumptions and intended validation scope to sales@bestpcbs.com. Confirm the proposed construction before treating the analysis as representative of the manufactured board.
You may also like


Tags: Copper Roughness, Huray Model, Insertion Loss, RF PCB Simulation