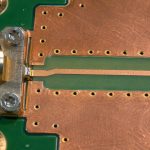


Use VNA time domain gating to investigate a PCB reflection only when the response you want to keep is separable from the response you want to suppress. Start with the ungated measurement and a known reference. If the peaks overlap or the answer changes sharply with small gate adjustments, do not use the cleaner trace to release the board.
VNA time domain gating
A vector network analyzer records complex values across frequency. The time-domain transform reorganizes that data by delay, so an engineer can look for reflections that arrive at different times. A gate then weights a chosen interval of the transformed response. Returning to the frequency domain shows how the adjusted response differs from the original measurement.
Imagine a 50 Ω RF test board with an SMA launch followed by a layer transition. The measured return loss has ripple. The question is whether a separately identifiable launch reflection contributes to it. The gate can help test that hypothesis, but it cannot make the physical launch disappear from an assembly that actually includes it.
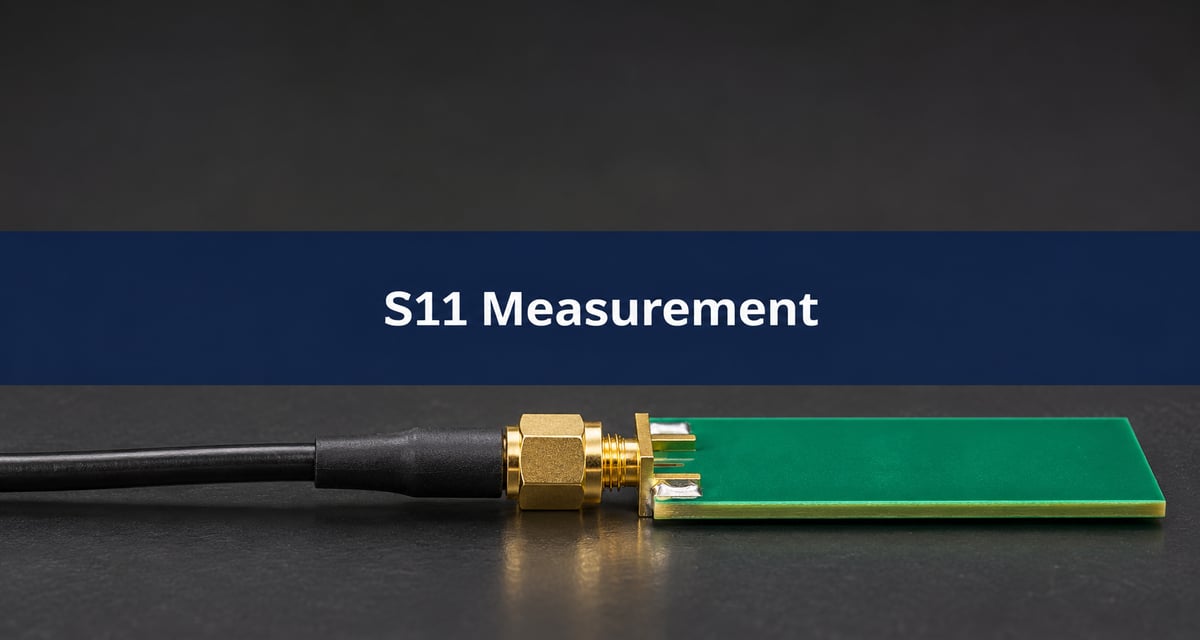
S11 measurement using network analyzer
S11 is the reflection measured looking into port 1, with the other port terminated in the specified reference impedance. Measure magnitude and phase, and keep the port direction and termination fixed. A magnitude-only export loses the phase information needed for a conventional time transform.
For the example board, use the same termination and sweep for a known reference coupon and the board under test. If the launch end and far end look interchangeable, mark the connectors physically and keep the port map with the file. The first response is not necessarily the first board feature; it depends on where calibration stops.
VNA calibration
Calibrate at the plane you intend to use. A calibration at a cable end does not automatically remove an adapter or PCB launch added after that plane. Establish whether each item belongs to the test fixture or the product and keep that decision consistent through comparison and reporting.
After calibration, check a known termination or coupon appropriate to the setup. Reconnect it and check that its response stays within the variability your decision allows. If peaks shift when the cable is moved or an adapter is reseated, first resolve that repeatability issue. Smoothing an unstable connection does not improve its underlying measurement.
VNA frequency range
For the illustrative sweep from 2 to 12 GHz, the span is 10 GHz and the reciprocal-span scale is 100 ps. This is a planning scale, not the guaranteed time resolution. The Keysight time-domain guide distinguishes response resolution from distance range and shows the effects of span, window and transform mode.
| Setting or parameter | Example | Check before using the gate |
| Usable frequency span | 2–12 GHz; span 10 GHz | Only use bandwidth supported by the fixture and calibration. |
| Frequency step | 10 MHz; 1,001 uniformly spaced points | Check time range and aliasing using the instrument’s transform settings. |
| Estimated local propagation speed | 160 mm/ns, assumed | Obtain a value from the actual line structure or a reference length if localization matters. |
| Reflection separation | 20 mm gives about 250 ps round trip | Verify that the two responses are resolved, not just farther apart than 100 ps. |
For two discontinuities along the same line, the extra round trip gives Δt ≈ 2Δx/v. With the same assumed speed, two features 10 mm apart are only about 125 ps apart. If the window broadens each peak or the reflections overlap, neither the displayed cursor precision nor a narrower gate makes those features reliably separable. These are planning calculations, not instrument or BestPCBs specifications.
Time domain windowing
A frequency-domain window changes how each reflection appears in time. Reducing sidelobes generally broadens the main response. This can expose a weak isolated echo that was masked by sidelobes, yet make two nearby features harder to distinguish. Window type therefore belongs in the report alongside the gate settings.
Use the initial transformed plot to place the gate outside the visible response you want to retain, allowing for the response tails. Vary the setting modestly and inspect the resulting frequency response over the actual requirement band. If it moves enough to change the decision, the result is sensitive to processing. Keysight’s gating reference describes how different gate choices retain or reject selected time intervals.
Time domain reflectometry
Use a reflection-versus-time view to locate candidate discontinuities, then use the appropriate calibrated impedance or physical inspection method to confirm them. A VNA bandpass impulse plot is not a direct step-response impedance profile. In this example the sweep begins at 2 GHz, so a low-pass or DC-equivalent interpretation should not be assumed without a separately validated setup.
A second echo can be the result of energy bouncing between discontinuities, not a second component at the distance indicated by a simple ruler conversion. Compare a reference coupon and a known geometry change before assigning an unfamiliar peak.
VNA de embedding
Choose a method based on what the test is meant to prove. Time gating can investigate isolated responses at the existing reference plane; validated de-embedding characterizes fixtures and removes their modeled effect so results can be expressed at another plane. One does not automatically substitute for the other.
| Approach | When to choose it | Evidence required |
| Ungated calibrated result | Product includes the launch or connector under test. | Show the full response at the specified plane and termination. |
| Time-domain gating | Estimate the contribution of a separately resolvable event. | Preserve raw data, gate and window; verify the result is stable when settings vary modestly. |
| Fixture de-embedding | Report the DUT at an internal plane with a characterized fixture. | Document the fixture and validate the method across the reporting band. |
IEEE 370 addresses electrical characterization of PCB interconnects and related structures. The BestPCBs fixture de-embedding guide covers the separate question of removing fixture effects. Do not treat a gated curve alone as evidence of conformity to a de-embedding procedure.
VNA time domain analysis
For the example board, retain both results and annotate the calibrated reference plane, sweep, transform, window, gate limits and DUT orientation. Repeat the experiment after reconnection. If the ungated response fails and only the gated response passes, report both. Unless the acceptance document explicitly permits that gate and excludes the affected structure, use the specified acceptance result and keep the gated curve as diagnostic evidence.
When the launch and transition cannot be separated, do not keep narrowing the gate until the plot looks better. Consider a suitable wider sweep if the calibration and fixture support it, a reference coupon that isolates the launch, or a validated fixture-removal procedure chosen for the actual test boundary.
Frequently asked questions
Does moving a gate move the reference plane?
No. A gate weights time-domain responses. Reference-plane changes need a separate, appropriate calibration or correction.
Does adding points always separate peaks?
No. At a fixed span more points reduce the spacing between acquired frequencies, which can extend the useful time range. They do not add the bandwidth needed for finer response separation.
Can I use a gate after repositioning an SMA cable?
First check a known reference and repeatability. Cable movement may change the raw measurement before any gate is applied.
Is the largest peak always the faulty connector?
No. Check its arrival time and response to an independently verified fixture or geometry change. A strong reflection can also obscure a smaller nearby event.
Can I determine a distance without knowing the propagation speed?
Report the measured delay. To convert it to physical distance, use a justified speed and the correct reflection or transmission path convention.
Can I infer an impedance in ohms from any VNA time plot?
No. An impedance profile requires the correct calibrated response and processing. A bandpass impulse shows events, not a direct impedance value.
Why does the gated frequency response look worse near an edge of the sweep?
Finite bandwidth, transform and gate processing can affect the resulting response, including at band edges. Compare against the ungated data and the instrument’s guidance before reporting those points.
What belongs in a supplier handoff?
Send the coupon drawing, port map, reference plane, sweep file and acceptance rule. Keep the raw and processed traces separately labeled.
Discuss your RF test coupon
For a Best Technology fabrication review, share the coupon geometry, stackup, connector footprint and test boundary with sales@bestpcbs.com. Identify whether the product specification includes the launch.
You may also like




Tags: PCB Reflections, RF PCB, Time Domain Gating, VNA Measurement